Download
1 / 33
340 likes | 472 Views
Topographic Data. Special Topic Presentation March 25, 2003 Dana French. Outline of Topics. Terminology General Information Tools in ArcGIS used with 3D data 3D analyst Spatial analyst Demonstration in ArcScene Uses for 3D data. Terminology. Planimetric Map:

E N D
Topographic Data Special Topic Presentation March 25, 2003 Dana French
Outline of Topics • Terminology • General Information • Tools in ArcGIS used with 3D data • 3D analyst • Spatial analyst • Demonstration in ArcScene • Uses for 3D data
Terminology • Planimetric Map: A map that represents the horizontal, but not the vertical, positions of the features represented
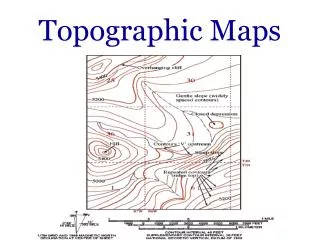
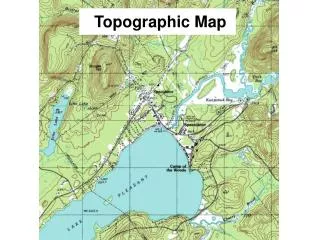
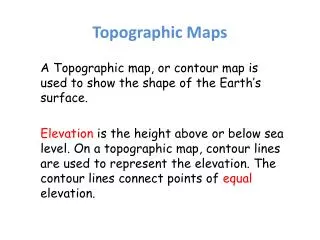
Terminology • Topographic Map: A map that displays both the horizontal and vertical positions of the features represented; distinguished from a planimetric map by the addition of relief in measurable form
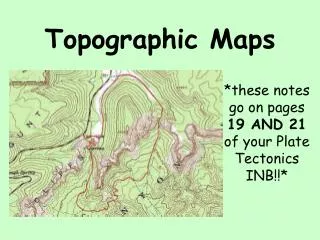
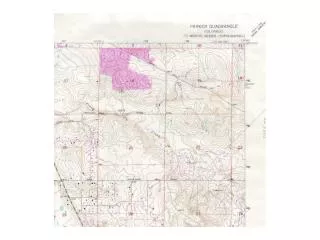
Information • Topographic images enhance our view of many physiographic features, especially in relatively flat areas. • One distinctive trait of a topographic maps is that contour lines are used to show the shape of the Earth's surface • Contour lines join points of equal elevation on the surface of the land above or below a reference surface such as mean sea level. • These lines allow the user to measure the height of mountains, depths of the ocean bottom, and steepness of slopeson the map.
More Information… • Topographic maps provide information about the shape of a landscape, as well as its natural features and purpose built structures. • Topographic data, also called 3D data must have some elevation attributes associated with it.
Tools that can be used with topographic data • ArcGIS • Spatial analyst extension • 3D analyst extension • ArcScene • A viewing tool
The spatial analyst extension The Spatial Analyst functions allow you to create informative maps from your data: • Creating a hillshade to use as a backdrop of the terrain to support other data layers. • Calculating slope, aspect and contours, or creating a map displaying visibility. • You can use derived data together to help solve spatial problems.
The 3D analyst extension • The 3D Analyst extension is the three-dimensional visualization and analysis extension to ArcGIS. • 3D Analyst adds a specialized 3D viewing application, called ArcScene, to your desktop • It also extends ArcCatalog and ArcMap so that you can effectively manage your 3D data, do 3D analysis, and edit 3D features.
Creating 3D features using the 3D analyst extension • Deriving the heights of existing features using the surface as a reference • Deriving the heights of existing features using an attribute • Creating 3D features by digitizing over a surface • Creating 3D graphics by digitizing over a surface
Deriving the heights of existing features using the surface as a reference • Add the 2D features and the surface to a map or scene. • Click 3D Analyst™, point to Convert, and click Features to 3D. • Click the Input Features dropdown arrow and click the features that you want to convert to 3D. • Click the Raster or TIN Surface button to set the source for the features heights.
Deriving the heights of existing features using the surface as a reference 5. Click the dropdown arrow and click the surface that you wish to use. 6. Optionally, browse to the location where you want to save the output feature class or shapefile. 7. Type the name of the output 3D feature class or shapefile. 8. Click OK.
Deriving the heights of existing features using an attribute • Add the 2D features to a map or scene. • Click 3D Analyst, point to Convert, and click Features to 3D. • Click the Input Features dropdown arrow and click the features that you want to convert to 3D. • Click the Input Feature Attribute button to set the source for the features heights.
Deriving the heights of existing features using an attribute 5. Click the Attribute that you wish to use for the features heights. 6. Optionally, browse to the location where you want to save the output feature class or shapefile. 7. Type the name of the output 3D feature class or shapefile. 8. Click OK.
Creating 3D features by digitizing over a surface • Add the 3D feature class (an existing feature class with one of the following geometries: pointZ, polylineZ, polygonZ) to which you want to add features to the map. • Add the surface that you want to use as the source for the features' height to the map. • On the Editor toolbar, click Editor and click Start Editing.
Creating 3D features by digitizing over a surface 4. If you have more than one feature class on the map, identify the workspace of the feature class in which you will be creating new 3D features. Click OK. 5. Click the Interpolate Point, Interpolate line, or Interpolate polygon button (depending on the geometry of the features class you are creating).
Creating 3D features by digitizing over a surface 6. Create the edit sketch for the feature just as you would for a 2D feature. 7. When you are finished digitizing, click Editor and click Save Edits. 8. Click Editor and click Stop Editing.
Creating 3D graphics by digitizing over a surface • Add the surface that you want to use as the source for the graphics height to the map. • Click the Interpolate Point, Interpolate line, or Interpolate polygon button (depending on the geometry of the graphics you are creating).
Creating 3D graphics by digitizing over a surface 3. Click the surface at the location where you want to start drawing. If you are using the Interpolate Point tool, a point will appear.If you are using the Interpolate Line or Interpolate Polygon tools, the first vertex will appear. Click the surface where you want to create the next vertex. 4. Double-click the surface to create the last vertex and finish drawing.
Demonstration of creating 3D data in ArcScene using the Charlottesville DEM • Open ArcScene • Turn on the 3D analyst extension by going to Tools, selecting extensions, and putting a check mark in the box corresponding to 3D analyst
Demonstration cont’d • Add the DEM • The picture on the right is what it looks like in two dimensional form
Demonstration cont’d • Next, right click on the name of the layer and go to properties • Select the base heights tab • Select the obtain heights for layer from surface option button • In order to make the topography of Charlottesville more noticeable, make the z unit conversion 5. This multiplies the slope of the data by 5
Adding contour lines to the data • Select the create contours button on the top toolbar • Click on any point and a contour line will be added at that elevation
Creating 3D layers by obtaining heights from the DEM • Add a 2D layer, for example, Albemarle county roads • As you can see, these layers are completely independent of one another. However, you can use the elevation data associated with the DEM to give corresponding heights to the roads
cont’d… • Again, right click on the name of the layer (in this case tgr515003lkA) and click on properties • Select the base heights tab • Make sure all the settings are the same as before
3D analyst surface analysis options The hillshade function obtains the hypothetical illumination of a surface by determining illumination values for each cell in an elevation grid.
3D analyst surface analysis options • Viewshed, another 3D analyst surface analysis option, allows you to determine visibility on a surface from point to point along a given line of sight, or across the entire surface • The contour function allows the user to add contours to the map at specified intervals • Slope and aspect, as well as area and volume calculations are options as well.
Uses for topographic data • modeling climate • water runoff • minimum safe aircraft flight altitudes • vacation planning • topographic data are often used in preparing visualization tools such as perspective or stereoscopic views of terrain.
Sources • http://www.ngdc.noaa.gov/seg/topo/state.shtml • http://edcdaac.usgs.gov/gtopo30/gtopo30.html • http://www.nrm.qld.gov.au/property/mapping/topographic_maps.html • http://www.dmtispatial.com/canadian_digital.html • http://mac.usgs.gov/isb/pubs/booklets/symbols/ • ArcGIS Desktop Help • Getting to Know ArcView GIS