
Topographic Maps
Topographic Maps. *these notes go on pages 19 AND 21 of your Plate Tectonics INB!!*. topography means “ shape of the land ” topographic maps graph a 3D landscape on a 2D surface showing elevation. Mount Rainier, Washington. Contour Lines :.

Topographic Maps
E N D
Presentation Transcript
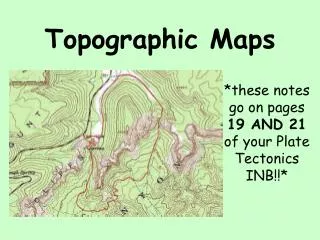
Topographic Maps *these notes go on pages 19 AND 21 of your Plate Tectonics INB!!*
topography means “shape of the land” • topographic maps grapha 3D landscape on a 2D surface showing elevation Mount Rainier, Washington
Contour Lines: • contour lines connect areas of equal elevation above or below sea level • index contours are darker with elevation marked • intermediate are lighter with no elevation
Contour Interval: • the elevation change that each line represents • FORMULA: distance between index contours ÷ # of contour lines
Water Direction: • “Rule of V’s”: contour lines make V’s indicating direction of flow of rivers & streams • V’s point uphill • help map reader interpret elevations of intermediate contours around stream
Hills: • contour lines are increasing in elevation within other contour lines • closer lines are together, the steeper the slope
Depressions • dips or major holes in land (from sinkholes, volcanoes, etc) • perpendicular contour lines, called hachures, point into depression Lip of depression is highest point
Benchmarks & Colors: • benchmarks: area of measured elevation in between contour lines (marked by an X or BM) • colors: • brown- contour lines • blue- water • green- forest, woods • black, pink & red- manmade structures
Gradient/Slope • how steep a hill is (look how close lines are!) • formula: = ∆ in elevation ÷ straight line distance • Units: m/km OR ft/mile
Slope Steep Slope Gentle Slope
Line A Distance = .5 miles Elevation Change = Slope =
Topo Map Profile: • cross sectional view along a line drawn through a topo map • HOW: • make a line through your map & label (X-Y, X-X’, etc.) • use edge of paper and make “ticks” every time a contour line intersects • record elevation next to each tick
X Y
transfer ticks onto a graph, or graph paper • connect the dots to get a side view along your line!
Map Projections • mathematical means of transferring info from 3D to 2D; different “views” • most have flaws because of curved surface • projections & flaws: (1) mercator- distorts areas near poles; view entire world (2) gnomonic- distorts areas away from center point; view poles (3) polyconic- distorts poles & Equator; view mid-latitudes (4) globe- no flaws; view entire world to scale
Gnomonic Projection Polyconic Projection Mercator Projection Three most common types of map projections are:
Map Distortions Greenland Mercator map size True size of Greenland
Map Scales: • mathematical relationship between objects on a map and their true life size • ratio or fraction • larger the number on the right, greater the amount of area map covers • same unit on each side • bar scale gives quick visualization of distances on a map


