
Abstract
Land Cover Analysis Utilizing Geographic Information Systems and Historic Aerial Photography: A Case Study of Riparian Zones in the Luckiamute River Basin, Central Oregon Coast Range.

Abstract
E N D
Presentation Transcript
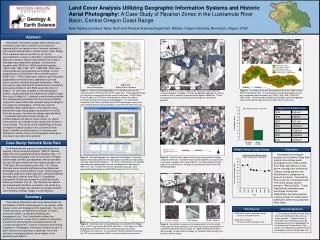
Land Cover Analysis Utilizing Geographic Information Systems and Historic Aerial Photography: A Case Study of Riparian Zones in the Luckiamute River Basin, Central Oregon Coast Range Ryan Stanley and Steve Taylor, Earth and Physical Sciences Department, Western Oregon University, Monmouth, Oregon, 97361 Abstract Geographic Information System (GIS) software and techniques were used to classify historic land-use regimes within the riparian zone of selected channels in the Luckiamute River Basin, central Oregon Coast Range. The Luckiamute drains over 800 sq. km. and is associated with a unique combination of geomorphic and land-use conditions that are well suited for the study of interdependent watershed variables. An archive of decadal scale USGS and USDA aerial photographs (1936, 1948, 1955, 1963, 1970, 1988,1994, 2000) were orthorectified and georegistered using Didger 4.0 and projected into the UTM Zone 10N coordinate system (NAD 1927). USGS digital raster graphics and orthophoto quadrangles served as known standards to provide control points for aerial photograph rectification. Affine and second order polynomial transformations consistently produced rectifications with RMS values less than 10 meters. For each year available in the photographic archive, stream channels were digitized as polyline shape files using ArcMap 9.2. A riparian-zone bounding polygon was subsequently generated from the channel polylines using a 500-meter buffer that extended along the length of the respective photographs. Idrisi32 was used for preliminary raster classification of the riparian zones, followed by supervised polygon vectorization in ArcGIS. From this process, five land-use classes were identified: (1) cultivated land without forest canopy, (2) undifferentiated land without forest canopy, (3) sparse forest canopy, (4) moderate forest canopy and (5) dense forest canopy. The results of this methodology form part of ongoing research studies in the Luckiamute River Basin to identify controlling factors on invasive plant distribution, identify zones of anthropogenic disturbance, and design river restoration projects. Unregistered: Aerial Photographs Registered : Digital Raster Graphics Figure 1: Historic aerial photographs of the intended study site are scanned at 600 DPI and saved as TIFF image files. These digitized photos are inherently unregistered and lack spatial information. USGS Digital Raster Graphics in UTM Zone 10N coordinate system are used as basemaps for georeferencing aerial photographs. The Monmouth, Lewisburg, Airlie North, and Airlie South DRG quadrangles shown here were used for determining control points at the Helmick State Park site. Figure 4: River channels are digitized by tracing over georegistered aerial photographs in ArcMap. A heads-up-digitizing approach to channel creation results in spatially registered vector polyline shapefiles. These river polylines serve as inputs for generating riparian zone buffer polygons. Figure 7: Five land-use classes were identified within the 1963 Helmick State Park riparian zone. The georegistering and vectorization process was repeated for each available year (1936, 1948, 1955, 1963,1970, 1990, 2000). Overall canopy change is quantified by calculating polygon areas and the percentage of forest canopy cover for each year. Case Study: Helmick State Park To demonstrate the process of classifying land-use regimes, historic aerial photographs (1963) of Helmick State Park were georeferenced and classified (Fig. 1-7). USGS aerial photographs from the University of Oregon archive were scanned, georegistered, and incorporated into the GIS environment as raster data projected in the UTM Zone 10N coordinate system (Fig. 1-3). Stream channels were manually digitized over georeferenced photographs as vector polylines (Fig.4). Buffer polygons were generated from stream polylines, effectively defining the study site’s riparian zone (Fig. 5). A qualitative assessment of land-use regimes is conducted visually before vectorization (Fig. 6). The five land-use classes are subsequently identified, vectorized, and coded (Fig. 7). Figures and maps were derived via multiple software tools including: ArcMap, Didger 4.0, and Idrisi32. Historic Forest Canopy Change Discussion Figure 2: Aerial photographs are registered using Didger 4.0 software. Spatial relationships between the photograph and DRG are calibrated by manually selecting control points. Four to ten control points are selected, depending upon photograph coverage and degree of image warping. RMS error values indicate the level of registration accuracy. Most georegistered photographs exhibit RMS values less than 10 meters. Figure 5: The 500-meter riparian buffer zone is generated in ArcMap using the Buffer tool. The Buffer tool uses river polylines as input values and creates a polygon with a total width of 1 km, perpendicular to both sides of the river channel. All land-use classification occurs within this bounding polygon. A complete chronological analysis of the Helmick State Park riparian zone utilizes aerial photographs from 1936 to 2000. Each flight year differs in scale, scene coverage and buffer area. Canopy change patterns are deciphered by comparison of percent unit areas. The Helmick Park study site is associated with 10% forest canopy decline between 1936 and 2000. These standardized methodological techniques of land-use classification are being used for ongoing studies of invasive plant distribution within the Luckiamute River Basin. Summary The Helmick State Park case study demonstrates the applicability of GIS for quantifying land-use regimes within riparian zones and displaying them graphically. The utility of GIS techniques for determining changes in historic land-cover makes it a valuable modeling and management tool. Such classification allows the partitioning of land in a way that is relevant to assessing the effects of anthropogenic disturbances within the Luckiamute watershed. In terms of research and training, integration of Geographic Information Systems as part of Earth Science curricula plays a significant role in the training of undergraduates as future leaders in the geoscience profession. Data Sources Acknowledgements USGS NAPP Aerial Photograph Program University of Oregon Archives Digital Raster Graphics 7.5 Minute USGS quadrangle maps The authors would like to thank those who have contributed to this land-use analysis project. A special thanks to Katie Noll, who methodically scanned the decadal scale aerial photographs at the University of Oregon library. Also, thanks to Ian Macnab for georeferencing photographs and classifying study sites. No Canopy Forest - Sparse Forest - Dense Figure 3: Georeferenced aerial photographs are exported from Didger 4.0 in a TIFF raster format with ESRI world files. In this figure, the 1963 photographs of Helmick Park were referenced and mosaiced to encompass the study site. As a qualitative check of positional accuracy, the TIFFs were layered over DRGs and inspected for inconsistencies. Figure 6: A qualitative assessment of canopy patterns occurs before vectorization of land-use classes. Five land-use classes are identified: (1) cultivated land without forest canopy, (2) undifferentiated land without forest canopy, (3) sparse forest canopy, (4) moderate forest canopy and (5) dense forest canopy.


