Download
1 / 60
600 likes | 727 Views
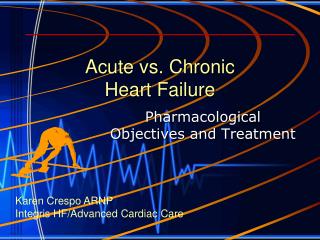
Acute Health Effects from Changes in Air Pollution and Weather in Heart Failure. Mark Goldberg, PhD Department of Medicine McGill University. 1. Findings for Postmenopauasal Breast Cancer. Total Cardiovascular Mortality (ICD9: 400-440).

E N D
Acute Health Effects from Changes in Air Pollution and Weather in Heart Failure • Mark Goldberg, PhD • Department of Medicine • McGill University 1
Total Cardiovascular Mortality (ICD9: 400-440) • PM2.5: 12% (95%CI: 1.09-1.15) increase in mortality rate for an increase of 10 μg/m3 • other pollutants: no strong evidence of association 6
Research Questions for Acute Effects • Does the number of adverse health events on a particular day increase if environmental conditions change on that day or on previous days? • How far back in time (lag) do these changes affect health? • If yes, are there certain populations particularly susceptible to these conditions?
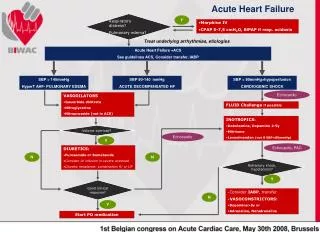
Air Pollution Episodes Donora, Pennsylvania (Oct 26-31, 1948) 14,000 residents 20 people died and over 7,000 were hospitalized London, UK (Dec 5-9, 1952) 3,000 more deaths
Aug 14 2002: PM2.5=37μg/m3 ~72 times lower than the 1952 London episode 9
Air Pollution Episode London, 1958-1959 NB: Mortality after removing 15-day running average Flu epidemic Feb 18-20 Excess mortality~200-250
Estimated attributable number of deaths in various smog episodes occurring in London, England, 1948-1962
Studies in Montreal • Daily nonaccidental mortality in Montreal, from Quebec death certificates, 1984-2002 • Daily weather conditions recorded at Dorval International Airport, 1984-2002 • Daily average concentrations of air pollutants (e.g., NO2, O3) from the various monitoring stations in Montreal 14
Time Series for Ozone, 1984-2002, Montreal. The solid line represents the long-term trend in the data.
Time Series for NO2, 1984-2002, Montreal. The solid line represents the long-term trend in the data.
Daily Nonaccidental Mortality, 1984-2002, Montreal The solid line represents the long-term trend in the data.
Filtered Mortality Time Series: Nonaccidental Causes
Daily Maximum Temperature, 1984-2002, Montreal. The solid line represents the long-term trend in the data.
Pooled Estimates of the Percent Increase in Daily Mortality From: Stieb et al. J Air Waste Manag.Assoc. 2003;53:258-61
Susceptible Populations: Time Series Study of Non-accidental Mortality Among Persons With Specific Health Conditions 27
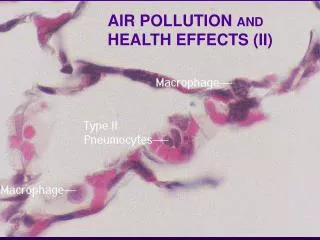
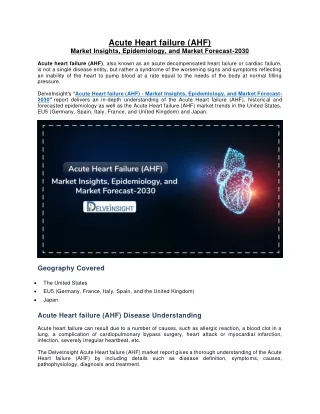
Mexico City air sample 1 μm Lung of Mexico City resident Particle Retention in Human Lungs Data from Michael Brauer, U. of British Columbia. 31
Controlled Human Exposure Studies Direct controlled human exposure studies to determine dose-response relationships of individual pollutants (if any) and uncover biological mechanisms. Findings: Inflammatory response after exposure Thickening of arterial walls Human Exposure Facility at the Gage Occupational and Environmental Health Unit of the University of Toronto . 32
Possible Mechanisms Source: Brook et al 2004 Circulation 33
Myocardial Infarction Hospitalizations and Maximum Temperature 36
Montreal: Recent Trends (April to September, inclusive) Red = Maximum temperature Blue = No. of days >25°C 40
Distribution of Maximum Daily Temperature, Montreal, 2003 41
Sometime in the Future when Mean Global Temperatures have Increased by 3°C 42
Excess Mortality from Climate Change, Montreal, Spring-Summer • 2001 (57 days >25°C): • Excess no. of deaths on days >25°C = 212 • Projected to 2100 (97 days >25°C): • Excess no. of deaths on days >25°C = 454 • Attributable to Global Warming (3°C): 454 - 212 = 242 deaths ~1.3 deaths/day during the “warm” season
Daily Diary Study of Congestive Heart Failure • Nadia Giannetti, McGill • Rick Burnett, Health Canada • Nancy Mayo, McGill • Marie-France Valois, McGill • Jay Brophy, McGill
Objective • To determine whether daily exacerbations in essential signs, symptoms, and physiologic indicators are associated with daily variations in concentrations of ambient air pollution and changing weather patterns 45
Design • Daily diary of signs and symptoms • Daily measurements of: • oxygen saturation, pulse rate • weight • blood pressure • Daily measurements of air pollutants and weather conditions from fixed-site stations 46
Design • ~2 months duration per subject • Very poor pumping of heart (ventricular ejection fraction <35%) • Published: Occupational and Environmental Medicine 2008;65:659-6 and Environ Res 2009;109:166-174 47
Page 2 48
Go Back 49