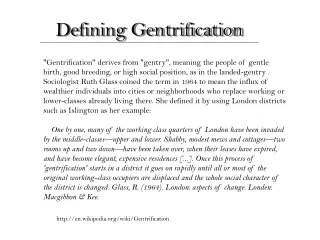
Download
1 / 6
60 likes | 425 Views
Hangry Gentrification Index Website. LA Neighborhoods:. Drop -down Menu Search. Type in Neighborhood Search. Gentrification Index, 2000-2012 Population change, 2000-2010 Population under 30 change, 2000-2012 Non-minority population change, 2000-2012 Non-family households change, 2000-2012

E N D
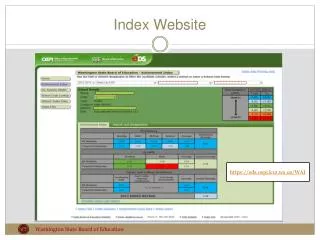
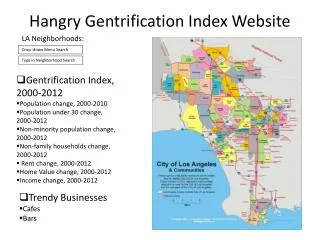
Hangry Gentrification Index Website LA Neighborhoods: Drop -down Menu Search Type in Neighborhood Search • Gentrification Index, 2000-2012 • Population change, 2000-2010 • Population under 30 change, 2000-2012 • Non-minority population change, 2000-2012 • Non-family households change, 2000-2012 • Rent change, 2000-2012 • Home Value change, 2000-2012 • Income change, 2000-2012 • Trendy Businesses • Cafes • Bars
Hangry Gentrification Index Website LA Neighborhoods: Select a neighbor hood here by two different methods On the map, click on a neighborhood to see it. The default map is the City of LA. Drop -down Menu Search Type in Neighborhood Search • Gentrification Index, 2000-2012 • Population change, 2000-2010 • Population under 30 change, 2000-2012 • Non-minority population change, 2000-2012 • Non-family households change, 2000-2012 • Rent change, 2000-2012 • Home Value change, 2000-2012 • Income change, 2000-2012 The default is to see the Gentrification Index for all of the variables You can also select each variable of the index to see a map As an additional layer, you can see “trendy” businesses that may be indicators of gentrification. This is would be real time data. • Trendy Businesses • Cafes • Bars
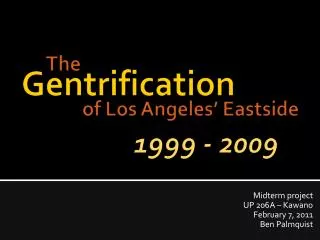
Boyle Heights Cafes LA Neighborhoods: Boyle Heights Type in Neighborhood Search • Gentrification Index, 2000-2012 • Population change, 2000-2010 • Population under 30 change, 2000-2012 • Non-minority population change, 2000-2012 • Non-family households change, 2000-2012 • Rent change, 2000-2012 • Home Value change, 2000-2012 • Income change, 2000-2012 • Trendy Businesses • Cafes • Bars
Boyle Heights Cafes LA Neighborhoods: If you select Boyle Heights on the drop down menu, you would see the map of the neighborhood This is a screen shot of a map from Yelp with cafes indicated Boyle Heights Type in Neighborhood Search You could also click on the Index or one of the variables as a map layer • Gentrification Index, 2000-2012 • Population change, 2000-2010 • Population under 30 change, 2000-2012 • Non-minority population change, 2000-2012 • Non-family households change, 2000-2012 • Rent change, 2000-2012 • Home Value change, 2000-2012 • Income change, 2000-2012 The viewer should be able to click on the icon to see the name of the cafe • Trendy Businesses • Cafes • Bars This map would indicate cafes in the neighborhood selected
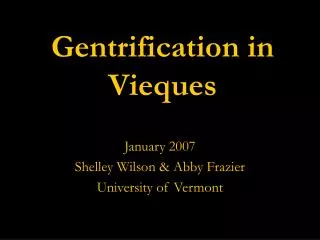
Boyle Heights Bars LA Neighborhoods: Drop -down Menu Search Boyle Heights • Gentrification Index, 2000-2012 • Population change, 2000-2010 • Population under 30 change, 2000-2012 • Non-minority population change, 2000-2012 • Non-family households change, 2000-2012 • Rent change, 2000-2012 • Home Value change, 2000-2012 • Income change, 2000-2012 • Trendy Businesses • Cafes • Bars
Boyle Heights Bars LA Neighborhoods: If you type in Boyle Heights in the search menu bar, you would see the map of the neighborhood This is a screen shot of a map from Google Maps with bars indicated Drop -down Menu Search Boyle Heights • Gentrification Index, 2000-2012 • Population change, 2000-2010 • Population under 30 change, 2000-2012 • Non-minority population change, 2000-2012 • Non-family households change, 2000-2012 • Rent change, 2000-2012 • Home Value change, 2000-2012 • Income change, 2000-2012 You could also click on the Index or one of the variables as a map layer The viewer should be able to click on the icon to see the name of the bar • Trendy Businesses • Cafes • Bars This map would indicate bars in the neighborhood selected