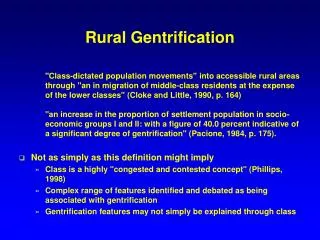
Gentrification
The. Midterm project UP 206A – Kawano February 7, 2011 Ben Palmquist. of Los Angeles’ Eastside. Gentrification. 1999 - 2009. What is gentrification?. New residents. (disproportionately young, white, professional, well educated and higher income). replace. old residents.

Gentrification
E N D
Presentation Transcript
The Midterm project UP 206A – Kawano February 7, 2011 Ben Palmquist of Los Angeles’ Eastside Gentrification 1999 - 2009
What is gentrification? • New residents • (disproportionately young, white, professional, well educated and higher income) • replace • old residents • in a disinvested inner-city neighborhood • (disproportionately low income, people of color, and the elderly) Source: Peter Marcuse, “Gentrification, Abandonment and Displacement: Connections, Causes and Policy Responses in New York City.” 28 Wash. U. J. Urb. & Contemp. L. 195 (1985).
Data & geography Produced by: Ben Palmquist • Data sources: 2000 U.S. Census, 2005-2009 American Community Survey • Indicators: income, race/ethnicity Skills: inset map, geoprocessing (clip layers to coastline)
Selection of census tracts Produced by: Ben Palmquist Skills: boundary subset selection (target layer features have their centroid in the source layer feature)
Selection of census tracts Produced by: Ben Palmquist Skills: boundary subset selection (target layer features have their centroid in the source layer feature)
Selection of census tracts Produced by: Ben Palmquist Skills: boundary subset selection (target layer features have their centroid in the source layer feature)
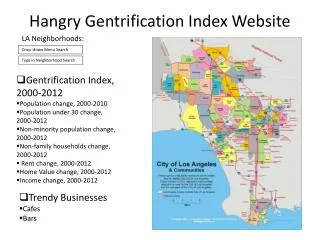
Income % change in household income, 1999 - 2009 HH Income % Change: Quintiles -98% - 5% 5% - 22% 22%39% 39% - 64% 64% - 688% Eastside Neighborhoods Produced by: Ben Palmquist Skills: graduate symbols, indices ( [medHHincome09 – medHHincome99] / medHHincome99)
Race and ethnicity 1999 2009 Produced by: Ben Palmquist Produced by: Ben Palmquist Skills: aggregating attributes (Native Hawaiian/Pacific Islander + Native American/Alaska Native + Multiracial + Other “Other”), geoprocessing (dissolve)
1999 - 2009 Race and ethnicity Net arrivals Net departures Produced by: Ben Palmquist Produced by: Ben Palmquist Skills: indices (net_arrivals = 2009_population – 1999_population; net_departures = (-1) * net_arrivals)
1999 - 2009 Race and ethnicity Net arrivals Net departures Produced by: Ben Palmquist Produced by: Ben Palmquist
Skills used • Inset map (LA County) • Graduated symbols (income) • Aggregating attributes (NHPI, NAAN, Other, Multiracial Other) • Indices (% change in householdincome, net arrivals & departures) • Boundary sub-sets selections (target layer features [census tracts] have their centroid in the source layer feature [Eastside neighborhood councils]) • Geoprocessing(clipping layers to the coastline, dissolving tracts together)
Questions • Does gentrification cause displacement? • Do high rates of mobility, low homeownership rates or other factors correlate with gentrification? Next steps • Widen the scope • Evaluate educational attainment, mobility and other indicators • Select census tracts by attribute to track both gentrification and displacement Produced by: Ben Palmquist Net departures


![[Ebook] Steal the Street: The Intersection of Homelessness and Gentrification](https://cdn7.slideserve.com/12479616/slide1-dt.jpg)
![READ [PDF] The Gentrification of the Mind: Witness to a Lost Imagination](https://cdn7.slideserve.com/12516121/slide1-dt.jpg)