Download

1 / 45
450 likes | 661 Views
LXe Beam Test Result. CEX beam test 2004 Cryogenic Equipment Preparation Status Liquid Xenon Photon Detector Group. Charge Exchange Beam Test at piE5. New PMTs R9288TB higher QE and better performance under high BG Resolutions to be improved New calibration alpha sources

E N D
LXe Beam Test Result CEX beam test 2004 Cryogenic Equipment Preparation Status Liquid Xenon Photon Detector Group
Charge Exchange Beam Test at piE5 • New PMTs R9288TB • higher QE and better performance under high BG • Resolutions to be improved • New calibration alpha sources • New refrigerator with higher cooling power • TEST at piE5 beam line • Gain experience • Analysis framework • ROME in online (offline also) analyses • Waveform data obtained with DRS prototype boards
Alpha sources on wires • 4 tungsten wires plated with Au (50 micron f) • Po attached on the wires, 2 active points per wire • ~40Bq per point on 2 wires at the rear side • ~130Bq per point on 2 wires at the front side • Active points are coated with Au (200-400Å) • Fixed on the wall with spring. • Alpha sources on the walls were removed wire LED gamma
New Refrigerator (PC150W) • MEG 1st spin-off • Technology transferred to a manufacturer, Iwatani Co. Ltd • Performance obtained at Iwatani • 189 W @165K • 6.7 kW compressor • 4 Hz operation
Eg 170o q Eg Eg p0 175o q 54.9MeV 82.9MeV 1.3MeV for q>170o 0.3MeV for q>175o Eg CEX Elementary process • p-pp0n • p0(28MeV/c) g g • 54.9 MeV < E(g) < 82.9 MeV • Requiring q>170o • FWHM = 1.3 MeV • Requiring q > 175o • FWHM = 0.3 MeV
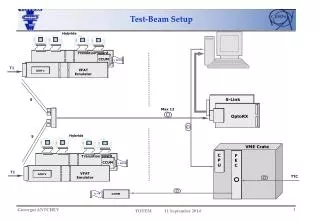
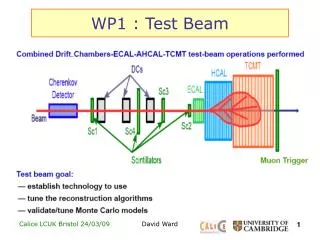
Beam Test Setup H2 target+degrader LYSO Eff ~14% NaI LP S1 Eff(S1xLP)~88% beam
Beam Condition • Profile at the target (with a pill counter) • Vertical 13.2mm • Horizontal 9.9mm • Pion rates (w/o separator) 1.8mA and 4cm Target E. • Slits 80: 2.07 x10⁸п-/sec • Slits 100: 3.95 x10⁸ п - /sec Optimization of degrader thickness 20mm + 3.3mm x n Profile at S1, 2mm/bin
Operation Status • Thanks to a new refrigeratorwe succeeded to operate the detector (almost) without using LN2 except for power break and recovery. • New pressure reducer also helped this while pre-cooling and liquefaction. • Circulation/purification continued during DAQ. • History • September • 18~21 Pre-cooling (72 hrs) • 21~24 Liquefaction (79 hrs) • 24 Circulation start (~30 cc/min) • 24 Electronics setup • October • DAQ started • 25 DRS boards installed • 29 Recovery of xenon
Data set • And Waveform data…
Analysis Result Calibration Energy Timing 1st look on waveform Data
Wire (50 μm ϕ) Alpha 40 μm Alpha data • One of the rear wires found to be slipped • Weighted position average surround wires due to shadow effect. Reconstructed Position is far from wires Po half-life=138 days
Source Position Reconstruction • The two wires on the front face are a little displaced LXe GXe
Alpha data analysis Nphe[0] Nphe[0] for top-left alpha with alpha emission angle selection Center of the PMT-0
LXe/MC, absorption length evaluation 4 front sources Applying the QEs determined in GXe (-75˚C)
Q.E. evaluation with alpha events in liquid Q.E. evaluation using alpha data in the liquid is also possible. Higher light yield Expected better evaluation if xenon is pure! R9288 R6041 Data #8528 normal gain front 4 alphas MC reflection on quartz on no absorption scattering length :45cm for 175 nm
Energy Reconstruction Cut-based Qsum Analysis Linear Fit Analysis
Analyze only central events to compare with the previous result |Xrec|, |Yrec|<2cm 70 MeV < ENaI+ELYSO < 105MeV Sigma2 > 40 (discard events if shallow) Sigma2: broadness of the event measured by using front face PMTs depth parameter Cut-based Qsum analysis Cut-based Qsum analysisEvent Selection 83 MeV to Xe 55 MeV to Xe Exenon[nph] MC
Cut-based Qsum analysis Correction and selection efficiency 83MeV 55MeV Before depth correction 78 % After depth correction with a linear function
Cut-based Qsum analysis Energy Resolution CEX 2004 CEX 2003 55 MeV s=1.53% FWHM = 4.5 ± 0.3 • = 1.23 ±0.09 % FWHM=4.8 % 83 MeV s=1.16 ± 0.06% FWHM = 5.0 ± 0.6 σ= 1.00±0.08 % FWHM=5.2%
In general it is possible to obtain higher efficiency with the linear fit analysis Linear Fit analysis Linear Fit analysis55 MeV event selection Y (cm) Correlation with NaI/Lyso 83 MeV in LXe 55 MeV in LXe X (cm) Small displacement (~ 0.5 cm)
Linear Fit analysis Energy (Linear Fit) and Qsum reconstruction No selection, 600k events NaI cut, 144k events Black: Linear Fit Red: QSUM Linear Fit trained using MC including Fresnel reflection; used Q.E. determined with six sources. No large differences changing Q.E. set. The Linear Fit works better. NaI+sat cut, 83k events NaI+sat+coll cut, 54k events NaI cut: 70 MeV<QNAI<100 MeV Coll. cut: (X2 + Y2)1/2< 4.75 cm
Linear Fit analysis Energy vs. DepthCorrection along X & Y E (MeV) E (MeV) E (MeV) No Need Anymore Red: all events; Green: no saturated We observed a slight position dependence of the reconstructed Energy. It can be corrected by using a parabolic interpolation. Z (cm) Remove ADC saturated events is equivalent to a depth cut.
Linear Fit analysis Reconstructed Energy (updated) 83MeV 55MeV Saturation & NaI cut FWHM = 5.6 % Saturation & NaI cut + R<1.5 cm FWHM = 4.8 % Correction (X&Y) effect 0.3 %
Timing Analysis Intrinsic, L-R analysis Absolute, Xe-LYSO
NaI g S1 g LP LYSO tLP - tLYSO The algorithm p- • T = TDC - Tref • TDC correction for time-walk and position • And correction for position • TL, TR by weighted average of Ti • <T> = (TLTR)/2 TL i=r.m.s. of Ti cut on Qi> 50 pe Left Right g TR
L-R analysis Intrinsic resolution, L-R analysis • Position and Tref corrections applied • Applied cuts: • |x|< 5cm,|y|<5cm • ELYSO+ENaI >20 MeV • RF bunch and TDC sat. • Study ofsvs Npe • s= 65 ps @ 35000 pe • s= 39 ps @100000 pe • QE still to be applied Old data New data
LYSO PMT1 & 2 Coorected for x-coord. (not for y) Corrections applied fortime walk (negligible at high energy deposit) LYSO slit slit gamma Xe- LYSO analysis Absolute resolution, Time reference (LYSO) (TLYSO(R) -TLYSO(L))/2 s=64 psec PMT1 PMT2 with 1cm slit
Xe- LYSO analysis Absolute timing, Xe-LYSO analysis high gain normal gain 103 psec 110 psec 55 MeV Normal gain High gain
LP Front Face DRS0 DRS1 DRS Setup • DRS inputs • LP: central 12 PMTs • LYSO: 2 anode signals for each DRS chip as time reference • Two DRS chips were available. • 10ch/chip (8 for data and 2 for calibration) in total 16 for data • 2.5GHz sampling (400ps/sample) • 1024 sampling cells • Readout 40MHz 12bit • Free running domino wave stopped by trigger from LP • DRS chip calibration • Spike structure left even after calibration, which will be fixed by re-programming FPGA on the board. Xe(g)
Simple Waveform Fitting • Simple function with exponential rise and decay can be nicely fitted to the xenon waveform. (and also LYSO waveform) • Other Fitting functions • Gaussian tail • V(t)=A(exp(-((t-t0)/τrise)2)-exp(-((t-t0)/τdecay)2)) • CR-RCn shaping • V(t)=A((t-t0)/τdecay)n exp(-(t-t0)/τdecay) • Averaged waveform • template τrise=7.0nsec τdecay=35nsec Xenon
Time constant γ α Pulse height [mV] a/g separation & LYSO timing • Alpha events are clearly discriminated from gamma events. • This does not highly depend on the fitting procedure. • LYSO time resolution is similar to that obtained with TDC. Pulse shape discrimination LYSO time resolution
Averaged Waveform • An averaged waveform can be used • for fitting as a template • for simulating pileup • for testing analysis algorithm etc. • The measured waveforms are averaged after synchronizing them with T0 • Use the “template” for fitting! • Pulse shape seems to be fairly constant for the gamma event. Average -160mV -1200mV -40mV
Simulation of Pileup Events • Overlapping pulses are simulated using averaged waveform to test rejection algorithm. • Real baseline data obtained by the DRSs is used. Npe1=2000phe Npe2=1000phe (3000phe is typical for 50MeV gamma) ΔT=+30nsec ΔT=+60nsec ΔT=-30nsec
Trial of Pileup Rejection • It seems easy to break up overlapping pulses >10ns apart from each other. • Rejection power is being investigated for different sets of (Npe1, Npe2) and ΔT. Npe1=2000phe Npe2=1000phe Original ΔT=-10nsec ΔT=-5nsec ΔT=-15nsec ΔT=+15nsec Differential ? easy easy Difficult but not impossible
PC150W performance at Iwatani • Condition: • 6.7kW(60Hz) 4Hz Twater=20 C (Iwatani 2003.12) • 6.0kW(50Hz) 4Hz Twater>30 C (PSI 2004.7) at PSI New PT(190W) and KEK original (65W) Calorimeter operation without LN2 at PSI(Sep.to Oct.2004) 42-day operation without degradation in cooling performance
17/Jan wire installation & closing the cryostat 24/Jan setup in PiE5 -13/Feb evacuation 7-20/Feb liq. N2 piping 14/Feb-13/Mar liquefaction and test 14/Mar recovery Current status/schedule of liquid-phase purification test Purifier cartridge Liquid pump • New calibration wires with higher intensity • 9MeV gamma from Nickel LP top flange xenon
The algorithm • TDC correctionfor time-walk and position (point-like approx) vertex reco. by weighted average of PMTs (new QE set, see Fabrizio Cei’s talk) • TL, TRby weighted average of Ti • <T> = (TLTR)/2 i=r.m.s. of Ti cut on Qi> 50 pe
The algorithm T9 F20 s = (2905) ps s = (345 5) ps Side PMTs are less sensitive to z-fluctuations than Front PMTs
TLXe - TLYSO • Global non-linear corrections for g-vertex (50 ps) • mainly due to: • scale compression (operated by PMT average) • finite shower size
Beam spot on target • Beam profile • sH = 13.2 mm • sV = 9.9 mm • (as measured by Peter) • sp = 62.3 ps