Download
1 / 24
240 likes | 375 Views
This lesson delves into probability calculations utilizing the standard normal distribution, focusing on making predictions based on the characteristics of normal distributions. The material includes definitions, applications of the central limit theorem, and practical examples relating to games of chance. Key concepts such as the standard normal distribution, prediction intervals, and the differences between prediction and confidence intervals are explained through problem-solving scenarios. Gain insights into the risks and expectations of game outcomes through statistical methods and probability theory.

E N D
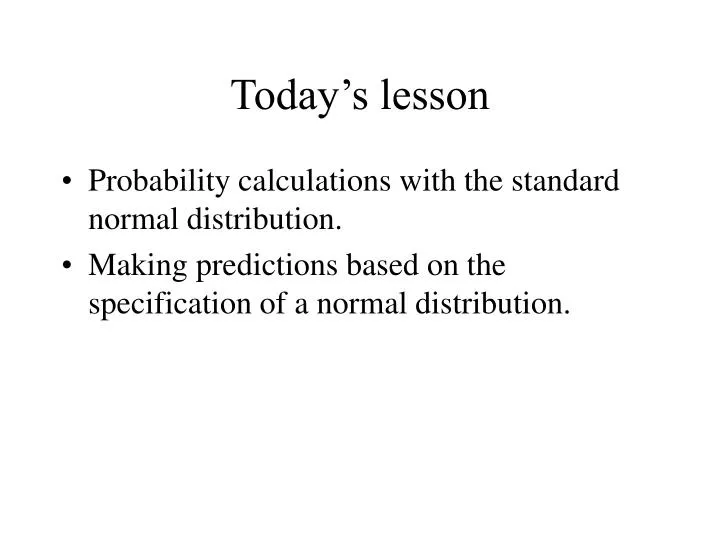
Today’s lesson • Probability calculations with the standard normal distribution. • Making predictions based on the specification of a normal distribution.
Chapter Ten: The Normal Distribution • Definition of Normal Distribution • Using tables of the standard normal distribution. • Solving basic problems with the standard normal distribution. • Central limit theorem for sums and averages
Definition of the normal distribution • Familiar bell-shaped curve • Continuous distribution, unimodal, symmetric, rapid fall-off of probability for values far from mean. • Probability density function, φ(z) • Cumulative distribution function, Ф(z)
Example Normal Distributions • IQ scores are set to be normal with mean 100 and standard deviation 10 or 15, depending on the form. • ETS examination score results are normal distributed with mean 500 and standard deviation 100.
Standard Normal Distribution • I always use Z to denote a standard normal. • E(Z)=0 • var(Z)=1 • Φ(z)=Pr{Z<=z} • Appendix D gives right and two-sided tail areas of standard normal (page 549). • I recommend using cdf tables (Ф(z)).
General Normal Distribution • Solve problems about any normal distribution by converting to standard normal. • STANDARDIZE the problem: • standard units=(value-expected value)/standard deviation. • Find probability.
Today’s Example Scenario • The winnings W in one play of a game of a game of chance is a normally distributed random variable with expected value -$200 and standard deviation $1000. • Advice: always sketch the distribution you are working with.
What is the probability that a gambler will win money in one play of this game of chance? • To win money means that W>0. • Must find Pr{W>0}. • Standardize both sides: • Pr{(W-EW)/σW > (0-(-200))/1000}= Pr{Z>0.2}=1-Ф(0.2)=1-0.5793=0.4207. • Answer is 0.4207. Does it make sense?
Prediction Intervals • ASS-U-ME quantity to be predicted Y has a normal distribution with known mean E(Y) and known variance σ2. • 95% prediction interval for Y is the interval between E(Y)-1.960σ and E(Y)+1.960σ. • 99% prediction interval for Y is the interval between E(Y)-2.576σ and E(Y)+2.576σ.
Differences between Prediction Intervals and Confidence Intervals • Forms are very similar. • A prediction interval contains an observable future value with specified probability. It is thus easy to know when a prediction interval is incorrect. • A confidence interval contains an unknown parameter with specified “confidence”.
What is the 99% prediction interval for the winnings in the next play of the game of chance? • The left end-point is E(W)-2.576σ. • Here, -$200-2.576(1000)=-$200-$2576. • There is a 0.005 probability that the gambler will lose $2776 or more. • The right end-point is E(W)+2.576σ=$2376. • There is a 0.005 probability that the gambler will win $2376 or more.
Central Limit Theorem for Sums • ASS-U-ME n independent identically distributed observations (usually called a random sample). • Focus on the sum of the n observations: • Sn=W1+…+Wn
Central Limit Theorem for Sums • E(Sn)=nE(W) • The “merry-go-round” principle. • Var(Sn)=nvar(W) • Note that sd(Sn)=n0.5sd(W) • The distribution of Sn is asymptotically normal.
What are the expected total winnings after 400 independent plays of this game of chance? • E(S400)=400E(W). • E(S400)=400(-$200)=-$80000. • Notice how quickly the losses mount.
Second standard problem • What is the standard deviation of the total winnings after 400 independent plays of this game of chance?
Solution • Sd(Sn)=n0.5sd(W) • Sd(S400)=4000.5(1000)=$20,000
Third Standard Problem • What is the symmetric 99% prediction interval for S400? • Solution: • Left endpoint is E(S400)-2.576sd(S400) • This is -$80000-2.576($20000)=-$131,520. • That is, there is a 0.005 probability that the gambler will lose $131,520 or more.
Third Standard Problem • Right endpoint is E(S400)+2.576sd(S400) • This is -$80000+2.576($20000)=$-28480. • That is, there is a 0.005 probability that the gambler will lose $28,480 or less. • The answer is that the 99% prediction interval is the interval between -$131,520 and -$28,480. • The gambler is very sure to lose a lot of money!
Fourth Standard Problem • What is the probability that a gambler will have total winnings that are greater than zero after 400 independent plays of this game of chance?
Solution • Standardize • Pr{S400>0}= • Pr{[(S400-E(S400))/sd(S400)] • (0-(-80000))/20000=4. • That is, =Pr{Z>4}=1-Φ(4)=0.00003. • The gambler has almost no chance of winning money after 400 independent plays.
Discussion of previous problems • The quantities sought are standard approaches to understanding the level of risk involved in a betting (insurance) strategy. • Realistic problems may require more advanced mathematics or simulation techniques.
Central Limit Theorem for Averages • ASS-U-ME n independent identically distributed observations (usually called a random sample). • Focus on the average of the n observations: • Mean=Sn/n=(W1+…+Wn)/n
Central Limit Theorem for Averages • E(Mean)=E(Sn)/n=(nE(W))/n=E(W) • The expected value of the mean is the expected value of the random variable that was sampled • Var(Mean)=(nvar(W))/n2=var(W)/n. • Note that sd(mean)=sd(W)/n0.5 • The distribution of Sn is asymptotically normal.
Major points covered • Definition of the normal distribution. • Use of the normal distribution tables. • Risk management example problems using the normal distribution. • Central limit theorem for sums. • Central limit theorem for averages.