Download
1 / 16
160 likes | 309 Views
Solar Prominence Properties derived from the UV-EUV SUMER spectral atlas. S. Parenti, J.-C. Vial, P. Lemaire IAS, Univeristé Paris Sud. The atlas: motivation. To carefully determine the complex physical character istics of the prominence.

E N D
Solar Prominence Properties derived from theUV-EUV SUMER spectral atlas S. Parenti, J.-C. Vial, P. Lemaire IAS, Univeristé Paris Sud
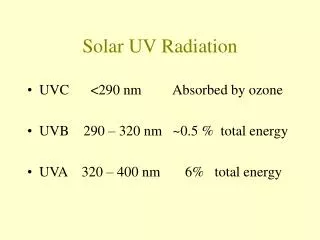
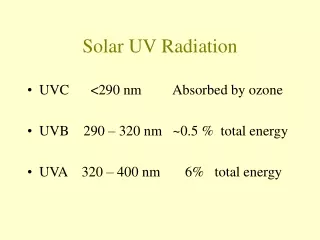
The atlas: motivation To carefully determine the complex physicalcharacteristics of theprominence. • We use SUMER (high spatial and spectral resolutions)to build an UV-EUV spectral Atlas. • A large spectral coverage in UV-EUV gives the coverage of a large range of temperatures (Chromosphere – Prominence Corona TR – Corona) • Spectroscopic informations: o, FWHM dynamics line Intensity N,T, Emission Measure, AX First complete atlas between 800 and 1250 Å
The data • Prominence and QS 10/’99 (MEDOC #4) • Spectral range: 800 - 1250 Å (det A) • Observation time 5:30h • Spectral windows of 40 Å ( 20 in the kbr)
Ly 13 N II Ly 19 Ly 11 Ly 8
Data processing • Determine the stray light contribution • Wavelength calibration for each spectral window, for the QS and prominence independently. • Multi-Gaussian line fitting of about 600 lines in each dataset. • Line identification and radiometric calibration. • About 30 new lines identified (mostly from ions at low ionization stage) between the QS and the prominence I, o, FWHM S. Parenti, J-C Vial, P. Lemaire, Sol. Phys, 220, 61, 2004
The Differentiel Emission Measure • Selection of observed lines intensities • CHIANTI (v 4.2) atomic database (Mazzotta et al. Ion fraction; coronal abundances) • Inversion technique to estimateDEM(T) • QS ; PRM1
The DEM: results Prominence A_1 Quiet Sun
Non Thermal Velocities • Lines from allowed transitions, well isolated and intense • T is for the maximum ionization fraction. For the neutrals: Chae et al. 1998
Non Thermal Velocities: results Chae et al., ApJ, 505, 957, 1998
Future work • We have produced the first complete UV-EUV prominence atlas in the range 800 Å- 1250 Å • Still 350 Å to be processed • We derived DEMs and NTVs for both QS and prominence physical interpretation • More physical properties to be derived.. Thank you Philippe!!!!