
Uploaded by
hachi
5 SLIDES
350 VIEWS
50LIKES
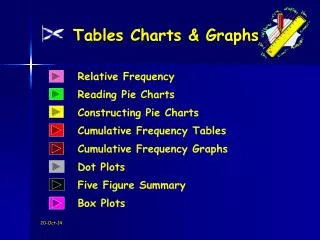
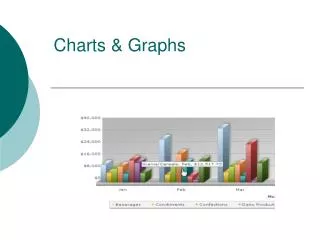
Graphs, Charts Tables
DESCRIPTION
The aim of this lesson is to be able to read, understand and extract data from a stem-and-leaf diagram. The following is a stem-and-leaf diagram representing the pulse rates of 12 students.. . 5. The stem . 6. 7. 8. . 6 8 9. 1 2 2 6 7 9. 2 4. 3. The leaves. . n = 12. The number of
Download
1 / 5
Download Presentation 
Graphs, Charts Tables
An Image/Link below is provided (as is) to download presentation
Download Policy: Content on the Website is provided to you AS IS for your information and personal use and may not be sold / licensed / shared on other websites without getting consent from its author.
Content is provided to you AS IS for your information and personal use only.
Download presentation by click this link.
While downloading, if for some reason you are not able to download a presentation, the publisher may have deleted the file from their server.
During download, if you can't get a presentation, the file might be deleted by the publisher.
E N D
Presentation Transcript


More Related
Audio
Live Player