Download
1 / 1
10 likes | 160 Views
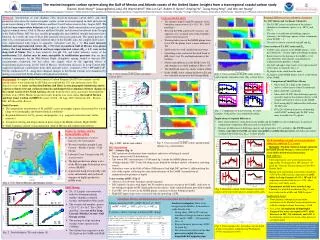
Regional differences in carbonate chemistry TA : DIC Ratios and Carbonate Chemistry The TA:DIC ratio is an indicator of the relative abundance of carbonate species (e.g., HCO 3 - and CO 3 2- )

E N D
Regional differences in carbonate chemistry • TA : DIC Ratios and Carbonate Chemistry • The TA:DIC ratio is an indicator of the relative abundance of carbonate species (e.g., HCO3- and CO32-) • The ratio is an indicator of buffering capacity (intensity): the buffering capacity attains a minimum when TA:DIC ~ 1 • The ratio is closely correlated with pH and ΩA. • Cross-sections of TA:DIC ratios and ΩA • TA:DIC ratios greatest in the MARS plume (~1.24, most buffered) – riverine input and biological uptake • Ratios lowest at the bottom of the GoME (~1.04, least buffered), reflecting the accumulation of remineralization products at depth. • All shelf and upper slope waters were supersaturated with respect to aragonite (ΩA > 1) • ΩAhigher in the south than the north • ΩAhighest in the MARS plume, lowest at the bottom of the GoME Abstract:Distributions of total alkalinity (TA), dissolved inorganic carbon (DIC), and other parameters relevant to the marine inorganic carbon system were investigated in shelf and adjacent ocean waters during a U.S. Gulf of Mexico and East Coast Carbon cruise in July–August 2007. TA exhibited near-conservative behavior with respect to salinity. Shelf concentrations were generally high in southern waters (Gulf of Mexico and East Florida) and decreased northward from Georgia to the Gulf of Maine. DIC was less variable geographically and exhibited strongly nonconservative behavior. As a result, the ratio of TA to DIC generally decreased northward. The spatial patterns of other CO2 system parameters closely followed those of the TA:DIC ratio. All sampled shelf waters were supersaturated with respect to aragonite (saturation state ΩA > 1). The most intensely buffered and supersaturated waters (ΩA > 5.0) were in northern Gulf of Mexico river-plume waters; the least intensely buffered and least supersaturated waters (ΩA < 1.3) were in the deep Gulf of Maine. Due to their relatively low pH, VA, and buffer intensity, waters of the northeastern U.S. shelves may be more susceptible to acidification pressures than are their southern counterparts. In the Mid-Atlantic Bight, alongshore mixing tended to increase DIC concentrations southward, but this effect was largely offset by the opposing effects of biogeochemical processing. In the Gulf of Mexico, downstream increases in Loop Current DIC suggested significant contributions from shelf and gulf waters, estimated at 9.1 × 10⁹ mol C d-1. Off the southeastern U.S., along-flow chemical changes in the Florida Current were dominated by mixing associated with North Atlantic subtropical recirculation. • Cross-section TA and S • The offshore high-S, high-TA signature of the boundary current waters (S > 36.5, TA ~ 2400 µmol kg-1) • Between the WFL and GA-NC transects, the apparent cross-sectional area of this boundary current water increased • Westward advection of the MARS plume from LA to TX: the plume water is more offshore at TX • Shelf water was well stratified in most areas • Upwelling event seaward of the shelf break at EFL (low t, low TA, and high nutrients at the bottom) • North-south difference in the MAB: lower TA and stronger cross-shelf gradient at MA vs. NC • The shelfbreak front was clearly evident at MA • In the GoME, water column had lowest TA and was stratified, except over the Georges Bank Cross-shelf Gradients Fig. 3. Cross-sections of TA (color) and salinity (contour lines) Fig. 6. Cross-sections of TA:DIC ratios (color) and aragonite saturation states (ΩA, contour lines) The marine inorganic carbon system along the Gulf of Mexico and Atlantic coasts of the United States: Insights from a transregional coastal carbon studyZhaohui Aleck Wang*1 (zawang@whoi.edu), Rik Wanninkhof2, Wei-Jun Cai3, Robert H. Byrne4, Xinping Hu5, Tsung-Hung Peng2, and Wei-Jen Huang31 Marine Chemistry and Geochemistry, Woods Hole Oceanographic Institution; 2 NOAA Atlantic Oceanographic and Meteorological Laboratory; 3 Department of Marine Sciences, University of Georgia; 4 College of Marine Science, University of South Florida; 5 Department of Physical and Environmental Sciences, Texas A&M University Corpus Christi • Background:In support of the North America Carbon Program (NACP) two summer coastal carbon cruises were conducted in 2007 that covered both the U.S. east and west coasts. The objectives were to assess carbon distributions and fluxes across geographic boundaries and to construct climate-relevant carbon inventories and budgets for evaluation of future changes in the coastal waters of the North America. Results from the west coast cruise have been reported by Feely et al. (2008). Herein we present results from the east coast cruise, the Gulf of Mexico and East Coast Carbon (GOMECC) cruise (10 Jul – 04 Aug, 2007, Galveston, TX – Boston, MA, R/V Ronald H. Brown). • Study Focuses: • The summertime distributions of TA and DIC across geographic regions characterized by a wide range of oceanographic and biogeochemical conditions • Regional differences in CO2 species and properties (e.g., aragonite saturation state, buffer intensity) • Alongshore mixing and biogeochemical processing in the Middle Atlantic Bight (MAB) • Shelf–boundary current–ocean interaction (Gulf of Mexico and southeastern shelves). • Comparison of Shelf Water Means • Mean shelf TA is high in the southern shelves, and decreases from GA northward • Mean shelf DICvaried little • Mean shelf TA:DIC (thus buffering capacity) generally high for the southern shelves; it fell steadily north of GA; lowest in the GoME • Shelf mean pHT(20) followed the shelf mean TA:DIC ratio • fCO2(20) followed an inverse relationship with TA:DIC, making high TA:DIC water more favorable for CO2 uptake Fig. 7. Comparisons of transect means for shelf samples. Vertical bars, one standard deviation. • Implications of regional differences • Most of the difference in ΩA between the nGMx and the GoME was due to differences in chemical composition; temperature difference only accounted for 15% • Because of differences in buffering capacity and temperature (CO2 solubility), the US NE coastal waters, especially the GoME, are more susceptible to acidification pressures and will reach critical ecological thresholds (e.g., ΩA = 1) more quickly • Transects, stations, and the oceanographic setting • Six coastal regions, 9 survey transects (by state names) • Western boundary margin: Loop Current – Florida Current – Gulf Stream • Labrador Coast Current in the NE coastal waters • The high production, plume water of the Mississippi-Atchafalaya river system (MARS) • A powerful Loop Current eddy with water entrainment and southward transport of highly productive nGMx water • Shelf–boundary current–ocean interactions along the southern U.S. coasts • Rationale: Tracking chemical changes along the flow path of Gulf Stream (a ‘conveyer belt’) to assess shelf-current-ocean interactions • Gulf of Mexico • The Loop Current core water experienced no appreciable TA change but a DIC increase ~65 µmol kg-1from the Yucatan entrance to the West Florida Shelf • Mixing with surrounding water likely contributes ~65% of this DIC increase, equivalent to a DIC influx (to Loop Current) of ~9.1 × 10⁹ mol C d-1;respiration accounted for the rest ~35%; other processes were likely minor • Entrainment of shelf water into the Loop Current is a plausible mechanism (Fig. 1), and best studied in the nGMx and WFLS regions. • Southeastern Coast • North Atlantic subtropical recirculation contributes to the Florida Current intensification, with the transport volume increasing ~3 fold • As a result, incorporation of oligotrophic Sargasso Sea water can explain >90% of the decreases in DIC, TA, nutrients, and AOU of the boundary current core water; other processes are likely minor Fig. 5. Cross-sections of DIC (color) and potential density (σ0, contour lines) Fig. 4. DIC, nitrate and salinity • DIC Distribution • DIC – Salinity (Fig. 4) • DIC and nitrate distributions show similarity, indicative of biological control • Sharp contrast with TA distributions • The lowest DIC concentrations (~1860 µmol kg-1) inside the MARS plume area • At high salinities, DIC–S data fell along an arc defined by offshore surface, subsurface, and deep waters • Subsurface water in the Gulf of Maine (NH transect) had high DIC and low S, different from the rest of the regions, reflecting the semi-enclosed nature of the GoME (accumulation of remineralization products at depth) • Cross-sections of DIC (Fig. 5) • Absence of an obvious boundary current signature • DIC tended to increase with depth, but TA tended to decrease (except in the GoME), indicative of net biological uptake of DIC dominated near the surface, while remineralization prevailed at depth. • Low-DIC, low-S waters in the MARS plume, consistent with net biological uptake • High-DIC upper-slope water associated with the upwelling at EFL Central Sargasso Sea Water Loop Current source water Fig. 1. U.S. Gulf of Mexico and Atlantic Coasts Shelf Mixing Fig. 8. Boundary current (Gulf stream) core-water means at the surveyed transects along its flow path. • TA - S: Largely conservatively, with two dominant mixing regimes sharing a common oceanic end-member (blue circle). • The oceanic end-member: mean t = 21.6 °C, S = 36.7, TA = 2404 μmol kg-1; the core of the Loop Current–Florida Current–Gulf Stream system • The mixing of slope and deep oceanic waters (green circle; >1000m) • Two distinct line segments on the TA-S plot in the GoME and MAB Alongshore Mixing and Biogeochemical Processing along the Northeastern Coast Salinity-normalized DIC (enDIC; Friiset al., 2003): To remove salinity (mixing) introduced DIC change • Analysis Assumption: Most water transport in the MAB is from north to south; Steady state • Along-shore (NH to NC) mixing introduced change in transect mean DIC and S : ΔDIC +120 µmol kg-1, ΔS = +3 • Biogeochemical processing: ΔDIC -86 µmol kg-1. • The downstream effects of the two processesroughly the same magnitude but opposing sign. Acknowledgement: We thank the officers and crew of the National Oceanic and Atmospheric Administration (NOAA) ship Ronald H. Brown and the participants of the 2007 Gulf of Mexico and East Coast Carbon (GOMECC) cruise (http://www.aoml.noaa.gov/ocd/gcc/GOMECC/participants.html). The study was supported by the NOAA Global Carbon Cycle Program, proposal GC05-208. We thank T. Clayton for insightful editorial assistance. We also express gratitude to Burke Hales and an anonymous reviewer for their substantial and constructive reviews. Fig. 9. Total transport (Sv) streamlines for the North Atlantic Circulation. Adopted from Worthington (1976) and Schmitz (1996). Fig. 2. Total alkalinity (TA) and salinity (S)