Download
1 / 24
240 likes | 398 Views
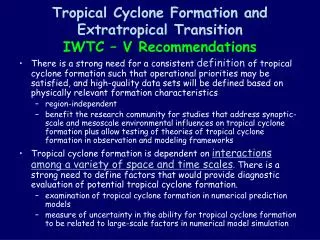
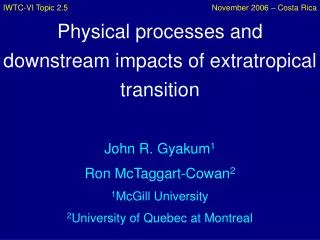
Data denial experiments for extratropical transition forecasts. Doris Anwender, Carla Cardinali, Sarah Jones. Acknowledgements: Roberto Buizza, Carsten Maas, ECMWF. ET impacts predictability. 500 hPa geopot. (556 gpdam) fcst 10 Sep. 12 UTC - 14 Sep. 12 UTC.

E N D
Data denial experiments for extratropical transition forecasts Doris Anwender, Carla Cardinali, Sarah Jones Acknowledgements: Roberto Buizza, Carsten Maas, ECMWF
ET impacts predictability 500 hPa geopot. (556 gpdam) fcst 10 Sep. 12 UTC -14 Sep. 12 UTC 500 hPa geopot. (556 gpdam) fcst 10 Sep. 12 UTC - 12 Sep. 12 UTC Typhoon Maemi 2003 500 hPa geopot. (556 gpdam) fcst 10 Sep. 12 UTC -13 Sep. 12 UTC
Observation Schematic of 4D-Var data assimilation Experiments with IFS (ECMWF) Background Analysis Truth time 0 -12 12 24 12 h 12 h 12 h 12 h assimilation window
Verification region: Europe Data denial experiments In regions around the TC (orange box) : ETout In sensitiv regions (extratropical singular vector 1): SVout In sensitiv regions on TC (singular vector 1 targeted on TC): TSVout Verification region: large
Measure of degradation 500 hPa geopotential: (RMSEA-FCtr - RMSEA-Fden) SVout/ Etout / TSVout Ex. forecast 1 Ex. forecast 2 1 2 3 4 5 day 1 2 3 4 5 day
Cumulative impact Time dependentaverageimpactofdenial in 8 storms 500 hPa Geopotential Impact over large domain Impact over Europe 8 6 4 2 0 -2 -4 -6 -8 8 6 4 2 0 -2 -4 -6 -8 ETout ETout SVout SVout 12 24 36 48 60 72 84 96 108 120 12 24 36 48 60 72 84 96 108 120 forecast time (hours)
ETout : Highest degradation for each forecast 0 40 80 120 160 200 av: -35 Magnitude of neg. impact on large area impact highest negative impact SVout SVout: Highest degradation for each forecast Fabian Maria Helene Chantal Cristobal Irene 0 40 80 120 160 200 av: -27 impact highest negative impact ETout Fabian Gabrielle Helene Chantal Maria Cristobal Irene Noel
ETout : Highest improvement for each forecast 200 160 120 80 40 0 av: 26.8 Magnitude of pos. impact on large area impact highest positive impact SVout SVout: Highest improvement for each forecast Fabian Maria Helene Chantal Cristobal Irene 200 160 120 80 40 0 av: 28.6 impact highest positive impact ETout Fabian Gabrielle Helene Chantal Maria Cristobal Irene Noel
ETout : Highest impact for each forecast 0 -100 -200 -300 -400 av: -59 Magnitude of neg. impact on Europe impact SVout: Highest impact for each forecast Fabian Maria Helene Chantal Cristobal Irene 0 -100 -200 -300 -400 av: -49 impact Fabian Gabrielle Helene Chantal Maria Cristobal Irene Noel
Denial regions for Helene Helene: 21 September 2006 00 UTC ETout SVout TSVout
Distribution of denial regions ECMWF Analysis 00Z21SEP2006 ECMWF Analysis 12Z21SEP2006 ECMWF Analysis 00Z22SEP2006 ECMWF Analysis 12Z22SEP2006
Distribution of denial regions ECMWF Analysis 00Z23SEP2006 ECMWF Analysis 12Z23SEP2006 ECMWF Analysis 00Z24SEP2006 ECMWF Analysis 12Z24SEP2006
How does denial in targeted SV regions affect the forecast? Strongest impact of 500 hPa geopotential over Europe 300 200 100 0 -100 -200 -300 -400 2100 2112 2200 2212 2300 2312 2400 2412 TSVout ETout SVout Initialization dates
Control -ETout Control - TCSVout AnCtr - AnETout AnCtr - AnTCSVout Impact due to ET Differencebetweencontrolanddenialforecastof 500 hPa geopotential over Europe Ini. time 21.09.08 00 UTC Verification 23.09.08 00 UTC
Impact due to ET Differencebetweencontrolanddenialforecastof 500 hPa geopotential over Europe Ini. time 21.09.08 00 UTC Verification 24.09.08 00 UTC Control - ETout Control - TCSVout
Impact due to ET Differencebetweencontrolanddenialforecastof 500 hPa geopotential over Europe Ini. time 21.09.08 00 UTC Verification 25.09.08 00 UTC Control - ETout Control - TCSVout
Impact due to ET Differencebetweencontrolanddenialforecastof 500 hPa geopotential over Europe Ini. time 21.09.08 00 UTC Verification 26.09.08 00 UTC Control - ETout Control - TCSVout
Impact due to midlatitude flow Differencebetweencontrolanddenialforecastof 500 hPa geopotential over Europe Ini. time 22.09.08 00 UTC Verification 24.09.08 00 UTC Control - ETout Control - TCSVout AnCtr - AnETout AnCtr - AnTCSVout
Impact due to midlatitude flow Differencebetweencontrolanddenialforecastof 500 hPa geopotential over Europe Ini. time 22.09.08 00 UTC Verification 25.09.08 00 UTC Control - ETout Control - TCSVout
Impact due to midlatitude flow Differencebetweencontrolanddenialforecastof 500 hPa geopotential over Europe Ini. time 22.09.08 00 UTC Verification 26.09.08 00 UTC Control - ETout Control - TCSVout
Impact due to midlatitude flow Differencebetweencontrolanddenialforecastof 500 hPa geopotential over Europe Ini. time 22.09.08 00 UTC Verification 27.09.08 00 UTC Control - ETout Control - TCSVout
Results for 8 denial cases: Cumulative impact shows both for the large domain and Europe: higher degradation for SVout up to 3 days higher degradation for ETout after 3 days but impact is small Strongest degradations both for the large domain and for Europe are distinctly stronger for ETout than for SVout
Results for Helene: Degradation for TCSVout is much stronger than both for ETout and SVout for almost every denial case Denial in ETout region important for degradation for very early forecast time and for times when TC was embedded in midlatitude flow Strong variability is seen in the impact of the denial from case to case For some cases inner structure of ET played important role for downstream propagation of errors, for others it played no role
Outlook: Strongest impact of 500 hPa geopotential over Europe 300 200 100 0 -100 -200 -300 -400 2100 2112 2200 2212 2300 2312 2400 2412 Which other ingredients of an ET may play also an important role? Inner structure Upstream trough Outflow Subtropical high pressure system