Download

1 / 20
200 likes | 445 Views
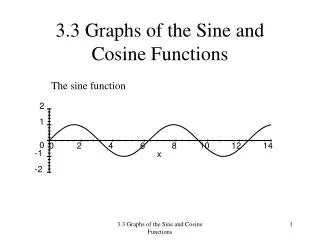
4.5 Graphs of Sine and Cosine Functions. Students will sketch the graphs of basic sine and cosine functions. Students will use amplitude and period to help sketch the graphs of sine and cosine functions. Students will sketch translations of graphs of sine and cosine functions.

E N D
4.5 Graphs of Sine and Cosine Functions • Students will sketch the graphs of basic sine and cosine functions. • Students will use amplitude and period to help sketch the graphs of sine and cosine functions. • Students will sketch translations of graphs of sine and cosine functions. • Students will use sine and cosine functions to model real-life data.
y (0, 1) 90° 60° 120° 135° 45° 30° 150° x 0° 180° (–1, 0) (1, 0) 210° 330° 315° 225° 240° 300° 270° (0, –1)
y (0, 1) 90° 60° 120° 135° 45° 30° 150° x 0° 180° (–1, 0) (1, 0) 210° 330° 315° 225° 240° 300° 270° (0, –1)
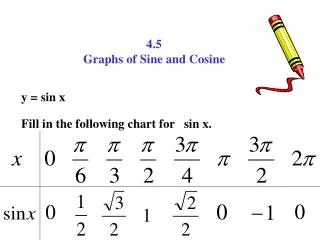
Section 4.5, Figure 4.44, Key Points in the Sine and Cosine Curves, pg. 288
Graph y = sin x and y = 2 sin x on your graphing calculator. Notice that the height of the hump has changed. In the equation y = a sin x is known as the amplitude of the function.
Graph y = cos x and y = cos 2x on your graphing calculator. Notice that the length of the curve has changed. In the equation y = cos bx, b affects the period of the function. Using sin and cos
Find the period and amplitude p. 294 #1
Find the period and amplitude p. 294 #11
Describe the relationship between the graphs of f and g. Consider amplitudes, periods, and shifts. p. 294 #15
Describe the relationship between the graphs of f and g. Consider amplitudes, periods, and shifts. p. 294 #21
Sketch the graphs of f and g in the same coordinate plane. (Include two full periods.) p. 294 #27