Download

1 / 20
210 likes | 572 Views
Graphs of Sine and Cosine Functions. Section 4.5. Fast Wave, Slow Wave. Who cares about waves??. Create the sine and cosine Graphs. Creating the Graphs. sine and cosine graphs. Sine graph plotted Cosine graph plotted. What about negative values?. Does the graph repeat? When?.

E N D
Graphs of Sine and Cosine Functions Section 4.5
Fast Wave, Slow Wave Who cares about waves??
Create the sine and cosine Graphs Creating the Graphs
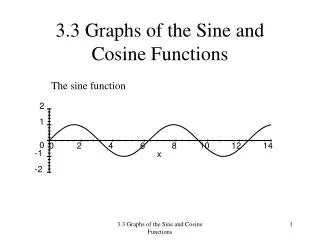
sine and cosine graphs Sine graph plotted Cosine graph plotted
Does the graph repeat?When? One complete cycle of the cosine and sine graphs is called the ___period___
Key Points What did you find??? Key Points What are key points? What do they mean?
Review – Graphing sine and cosine • Where do they graphs come from?!? • Graphing Sine and Cosine – Review • graphing sine and cosine - radians
Listing the Key Points Sinx:(0°,0) (90°, 1) (180°,0) (270°, -1) (360°, 0) Cosx:(0°,1) (90°,0) (180°, -1) (270°, 0) (360°, -1)
Transformations to the parent graphs – sine and cosine • We will see how transformations affect the basic sine and cosine parent graphs
General Equations: • y = asin(bx – c) + d • y = acos(bx – c) + d
Vertical Translations • A vertical shift is the vertical distance between the midline of the graph and the x –axis. • For y = sinx +d and y = cosx +d, the constant d causes a vertical shift in the graph • Which value (x or y) is influenced by the change in the “d” value?
What’s Happening?? Transformations of Sine and Cosine
Vertical Translations • The shift is d units upward for d >0 • The shift is d units downward for d< 0 • The graph oscillates about line y = d instead of x-axis • Does the period change when “d” changes?
Amplitude • The amplitude of y = asinx and y = acosx represents the vertical distance between the midline and the maximum or minimum • Amplitude = |a| • The constant factor “a” is a scaling factor - a vertical stretch or shrink of the basic sine and cosine curves
What’s Happening?? Transformations of Sine and Cosine
Amplitude…What Does It Do?? • If a ≥ 1, the basic sine curve is stretched vertically • If a ≤ -1, the basic sine curve is reflected across the x-axis and vertically stretched • The graph of y = asinx ranges between -a and a instead of between -1 and 1
Amplitude…What Does It Do?? • If 0 <a < 1, the basic sine curve is vertically shrunk • If -1< a < 0, the basic sine curve is reflected across the x-axis and vertically shrunk • The graph of y = asinx ranges between -a and a instead of between -1 and 1