Download
1 / 23
250 likes | 763 Views
Graphs of the Sine and Cosine Functions. Section 4.5. Objectives. Determine the amplitude, period, and phase shift of the graph of a sine or cosine function given an equation. Match a graph to its equation.

E N D
Graphs of the Sine and Cosine Functions Section 4.5
Objectives • Determine the amplitude, period, and phase shift of the graph of a sine or cosine function given an equation. • Match a graph to its equation. • Determine the amplitude, period, and phase shift of the graph of a sine or cosine function given a graph. • Write the equation of the graph of a sine or cosine function given a written description or a graph.
Vocabulary • period • amplitude • midline • phase shift • periodic graph • sinusoidal graph
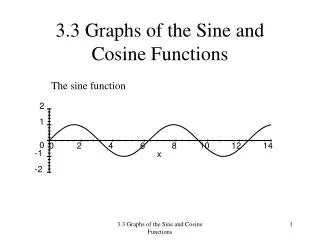
Graph the function sin(x) on the interval [―2π, 2π] What is the period? What is the midline? What is the amplitude? What is the phase shift? 2π y = 0 1 none on original graph
Graph the function sin(x) on the interval [―2π, 2π] Something else that you should note about the sin(x) function is that it is an odd function. In general for an odd function f(-x)=-f(x). Specifically for the sine function sin(-x) = -sin(x) for all x. In terms of the graph, if you rotate the original graph 180 degrees, you get a new graph that looks exactly like the original. original rotated 180 degrees
Graph the function cos(x) on the interval [―2π, 2π] What is the period? What is the midline? What is the amplitude? What is the phase shift? 2π y = 0 1 none on original graph
Graph the function cos(x) on the interval [―2π, 2π] Something else that you should note about the cos(x) function is that it is an even function. In general for an odd function f(-x)=f(x). Specifically for the sine function cos(-x) = cos(x) for all x. In terms of the graph, if you reflect the graph over the y-axis, you get a new graph that looks exactly like the original. original reflected over y-axis
What is the amplitude of the graph of f(x) = 10 sin(x) To answer this question, we need to remember the basic equation of a sine function where In our equation A is 10, B is 1, C is 0 and D is 0. Thus the amplitude is |10| = 10.
What is the period of the graph of f(x) = 10 cos(6x) To answer this question, we need to remember the basic equation of a cosine function where In our equation A is 10, B is 6, C is 0 and D is 0. Thus the period is (2π)/6 .
For the graph of What is the period? To answer this question, we need to remember the basic equation of a cosine function where In our equation A is 9, B is 4, C is –π/5 and D is 0. Thus the period is (2π)/4 . continued on next slide
For the graph of What is the midline? To answer this question, we need to remember the basic equation of a cosine function where the midline is related to the vertical shift. In our equation A is 9, B is 4, C is –π/5 and D is 0. Thus since there is no vertical shift (D = 0), the midline is y = 0. continued on next slide
For the graph of What is the amplitude? To answer this question, we need to remember the basic equation of a cosine function where In our equation A is 9, B is 4, C is –π/5 and D is 0. Thus the amplitude is |9| = 9. continued on next slide
For the graph of What is the phase shift? To answer this question, we need to remember the basic equation of a cosine function where In our equation A is 9, B is 4, C is –π/5 and D is 0. Thus the phase shift is |(-π/5)|/4 = π/20 to the right.
The curve below is the graph of a sinusoidal function. It goes through the point (5, 2). Find a sinusoidal function that matches the given graph. To start this problem, we need to find the midline. We can find this by find the vertical distance between a high point and a low point. The vertical information is in the y-coordinates. One high point is (5, 2). One low point is (0, -2). This distance between the two is the absolute value of the difference between the y-coordinates or |2-(-2)| = 4. The midline is half way between these two point or 2 away for either. Two units below a high point is at 0. This gives us a midline of y = 0. continued on next slide
The curve below is the graph of a sinusoidal function. It goes through the point (5, 2). Find a sinusoidal function that matches the given graph. Now we look at the intersection of the midline and the y-axis. If the graph passes through this intersection, then the equation is most easily written as a sine equation. If the graph has a high point or a low point at the y-axis, then the equation is most easily written as a cosine equation. Our graph has a low point at the y –axis, thus we will use a basic cosine equation. continued on next slide
The curve below is the graph of a sinusoidal function. It goes through the point (5, 2). Find a sinusoidal function that matches the given graph. Now we just need to fill in numbers for A, B, C, and D. We already know that D is 0 since the midline is y = 0. We also know that C is 0 since we are going to attempt to write the equation of graph as a cosine function without a phase shift. continued on next slide
The curve below is the graph of a sinusoidal function. It goes through the point (5, 2). Find a sinusoidal function that matches the given graph. Let’s now try to fill in for A. In our example A will need to be negative since the basic cosine graph has a high point on the y-axis. Our graph has been reflected over the x-axis and thus has a low point on the y-axis. We also know that |A| is the distance between the midline and a high point. The midline is y = 0 and a high point is (5, 2). Thus |A| = |2-0| = 2. Thus A is -2. continued on next slide
The curve below is the graph of a sinusoidal function. It goes through the point (5, 2). Find a sinusoidal function that matches the given graph. Let’s now try to fill in for B. We know that for a cosine function the period of the function is question to (2π)/B. We can find the period by counting the number of units between two low points on this graph (we can do this between any two easy to see point in the same relative position to the period on the graph). Here we see that the period is 10 units. continued on next slide
The curve below is the graph of a sinusoidal function. It goes through the point (5, 2). Find a sinusoidal function that matches the given graph. Now we take the period of 10 and plug it into the equation to solve for B. continued on next slide
The curve below is the graph of a sinusoidal function. It goes through the point (5, 2). Find a sinusoidal function that matches the given graph. Thus our equation is We can check this answer by graphing the equation on our calculator using the same window to see if it matches the graph given.