Analyzing Technology Progress at Carthage ISD Junior High: 2005-2008 StaR Chart Insights
This report delves into the technology progress of Carthage ISD Junior High, as outlined in the Texas StaR Chart from 2005 to 2008. It highlights the strengths and weaknesses in critical areas: Teaching and Learning, Educator Preparation, Leadership & Administration, and Technology Infrastructure. The analysis reveals that over two years, the classification remained at “Developing Tech,” with some fluctuations indicating shifts in focus and resources. Notably, significant improvements in infrastructure and educator preparation are documented following campus-wide technological upgrades.

Analyzing Technology Progress at Carthage ISD Junior High: 2005-2008 StaR Chart Insights
E N D
Presentation Transcript
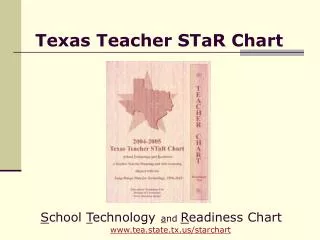
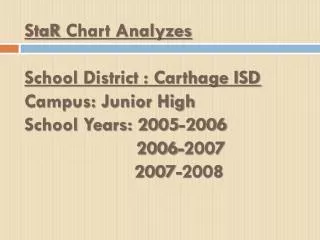
StaR Chart Analyzes School District : Carthage ISDCampus: Junior HighSchool Years: 2005-2006 2006-2007 2007-2008
Star Chart Analysis and Presentation • The Texas Campus StaR Chart has been created to show the strength and weakness of the four domains created by the Long-Range Plan for Technology, 2006-2020. Its main purpose is to show schools summaries and progress in each of the domains: Teaching and Learning; Educator Preparation and Development; Leadership, Administration and Instructional Support; and Infrastructure for Technology. Level of progress is described in four classifications: Early Tech, Developing Tech, Advanced Tech and Target Tech.
StaR Chart Analyzes As reported, on our Campus StaR charts, during the last two years all four of our key areas had the same exact key area classifications (Developing Tech), with slightly higher scores in the areas of Leadership, Administration and Instructional Support. However, in the year 2005-06, that key area was classified as advanced tech, and it was listed as one of the lowest key areas. In the year 2005-06, our Campus STaR Chat Summary scored the highest on Educator Preparation and Development. During that time the Teacher STaR Chart participation was still voluntary. During the 2005-06, and the 2006-07 school year, the STaR chart listed Infrastructure as our campus greatest weakness. During that time, our computers and infrastructure were not as advanced as they are now. Five years ago our entire campus was restructured, rewired, and equipped with new technology hardware. Most of our computers are now directly connected to internet and almost every teacher and administrator has their own computer. In addition, most rooms are now also connected to WAN and LAN. In the year 2005-06 our campus was classified as advanced tech (14) in the key area of infrastructure and the following two years we classified as developing tech.
Summary Area Explanation Teaching & Learning • Have access to relevant technologies, tools, resources, and services for individual instruction 24/7 • Use information and communication technologies to collaborate, construct knowledge and provide solutions to real world problems. • Use research based strategies in all subject based areas to improve academic achievement. • Communicate effectively in a variety of formats for diverse audiences. Educator Preparation & Development • Graduate from and educator preparation program that models current technology in instructional and administrative practices preK-12. • Exit educator programs knowing how to use technology effectively in the teaching and learning process. • Develop new learning environments that utilize technology as a flexible tool where learning is collaborative, interactive and customized. • Ensure integration of appropriate technology throughout all of curriculum and instruction.
Summary Area Explanation Leadership, Administration, & Instructional Support • Develop, implement, budget for and monitor a dynamic technology plan to meet the needs of a changing workforce and economy. • Create innovative, flexible and responsive environments to maximize teaching and learning and community involvement. • Offer expanded curriculum and instructional opportunities to students via online, digital technology, and a variety of distant learning technologies • Provide opportunities for sustained, relevant and timely staff development in a variety of formats. • Expect and plan appropriate technology use technology the teaching and learning process as well as throughout administration. • Use data effectively and appropriately in decision making. Infrastructure for Technology • Access to all learning technologies through ubiquitous broadband resources available 24/7 for all users. • Just in time technical assistance to support teaching and learning. • Measure to ensure all data is secure and accurate. • Data standards to support interoperability and accessibility for all users.
WebPages To gain a better understanding of the Long-Range Plan for Technology 2006 – 2020 and the Texas StaR Chart please refer to the following web pages. http://starchart.esc12.net/resources.html http://ritter.tea.state.tx.us/technology/lrpt/
References Long-Range Plan for Technology 2006 – 2020, Retrieved May 27, 2010 from http://ritter.tea.state.tx.us/technology/lrpt/LRPTCompleteDec06.pdf (copied page 15) Texas StaR Chart, Retrieved May 27, 2010 from http://starchart.esc12.net/resources.html