
CH 2 PWPT
E N D
Presentation Transcript
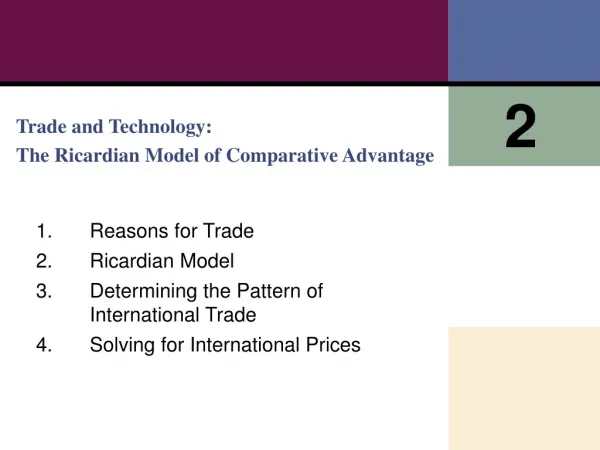
2 Trade and Technology: The RicardianModel of Comparative Advantage
Introduction • In this chapter we will: • Overview, briefly, the reasons why countries trade • Distinguish between absolute and comparative advantage • Understand the Ricardian model • Understand the no-trade equilibrium using each country’s PPF and indifference curve • Derive the home export supply curve and foreign import demand curve and how to arrive at international trade equilibrium • Solve for international prices • Understand how to determine a country’s terms of trade and how they affect that country • Solve for wages across countries
Introduction Some reasons countries trade goods with each other: ■Ch. 2. Differences in the technology used in each country (i.e., differences in each country’s ability to manufacture products) ■Chs. 3, 4. Differences in the total amount of resources (including labor, capital, and land) found in each country ■ Differences in the costs of offshoring (i.e., producing the various parts of a good in different countries and then assembling it in a final location) – We will cover in bonus chapter (see syllabus). ■ Similar countries trading differentiated products (variety – e.g., cars) ■ The proximity of countries to each other (i.e., how close they are to one another, low transport costs)
“Proximity broadly interpreted” • Adam Smith
Introduction • In this chapter, we focus on technology differences across countries as an explanation for trade. • The technology-differences explanation for trade is called the Ricardianmodel in honor of its developer. • This model explains how the technologies of countries determine their comparative advantage and thereby the trade pattern between countries. • The model also allows us to determine the terms of trade and real wages.
Introduction • Continued, • The basic Ricardian Model also illustrates the structure we use for other models of trade. • In chapters 3 and 4 we will study other models of trade which do not rely on technological differences. • But even in these other models you will see strong parallels in how the models are constructed. • Components: goods, inputs, technology, endowments, preferences, markets, prices.
1 Reasons for Trade Proximity • The closer countries are the lower the costs of transportation. For example, the largest trading partner of most European countries is another European country. • Sometimes neighboring countries take advantage of their proximity by joining into a free-trade area, in which the countries have no restrictions on trade between them.
1 Reasons for Trade Resources Geography includes the natural resources (such as land and minerals) found in a country, as well as its labor resources (labor of various education and skill levels) and capital (machinery and structures). A country’s resources are often collectively called its factors of production, the land, labor, and capital used to produce goods and services.
1 Reasons for Trade Absolute Advantage When a country has the best technology for producing a good, it has an absolute advantage in the production of that good. Comparative Advantage We will find that absolute advantage is notan explanation for trade patterns. Instead, comparative advantage is an explanation for trade among countries. Loosely stated, a country has comparative advantage in producing those goods that it produces best compared with how well it produces other goods.
SIDEBAR David Ricardo (1772-1823) Video link • Ricardo disagreed with the trade theory of his times (and still a popular notion today) that a country benefited from trade if it exported a lot and imported only a little, a theory that supported import tariffs. • Ricardo was interested in showing that countries benefit from international trade by not having tariffs. • Many of the major international institutions in the world today are founded on Ricardo’s idea that free trade between countries brings gains for all trading partners.
2 Ricardian Model • To develop a Ricardian model of trade, we will use an example with two goods: • Wheat and other grains are major exports of the U.S. and Europe. • Many types of cloth are imported into these countries. • To simplify our example, we will ignore the role of other inputs to production (land and capital) and suppose that both goods are produced with labor alone. 2 countries (“home, foreign”), 2 goods, 1 input
2 Ricardian Model The Home Country Assumption. We will assume that labor is the only resource used to produce both goods. Definition. The marginal product of labor (MPL) is the extra output obtained by using one more unit of labor. Note. In the Ricardian model MPL is same no matter how much labor you are using.
2 Ricardian Model The Home Country • Example. In the Home country, • One worker produces 4 bushels of wheat, so MPLW= 4. • Alternatively, one worker can produce 2 yards of cloth, so MPLC= 2. • Country has a resource endowment of 25 units of labor. Cloth Wheat
Group 3. In the Home country, • One worker produces 4 bushels of wheat, so MPLW= 4. • Alternatively, one worker can produce 2 yards of cloth, so MPLC= 2. • Country has a resource endowment of 50 units of labor. • Group 1. In the Home country, • One worker produces 4 bushels of wheat, so MPLW= 4. • Alternatively, one worker can produce 2 yards of cloth, so MPLC= 2. • Country has a resource endowment of 25 units of labor. • Group 2. In the Home country, • One worker produces 2 bushels of wheat, so MPLW= 2. • Alternatively, one worker can produce 1 yards of cloth, so MPLC= 1. • Country has a resource endowment of 50 units of labor. • Group 4. In the Home country, • One worker produces 4 bushels of wheat, so MPLW= 4. • Alternatively, one worker can produce 1 yards of cloth, so MPLC= 1. • Country has a resource endowment of 25 units of labor.
2 Ricardian Model The Home Country Home Production Possibilities Frontier Using the marginal products for producing wheat and cloth, we can graph Home’s production possibilities frontier (PPF). The slope of the PPF is also the opportunity cost of wheat, the amount of cloth that must be given up to obtain one more unit of wheat. If all 25 workers were employed in wheat, the country could produce 100 bushels. If they were all employed in cloth they could produce 50 yards. The PPF connects these two points.
Home Production Possibilities Frontier MPLW= 4, MPLC= 2, L = 25 FIGURE 2-1 The Home PPF is a straight line between 50 yards of cloth and 100 bushels of wheat. The slope of the PPF equals the negative of the opportunity cost of wheat. Equivalently, the magnitude of the slope can be expressed as the ratio of the marginal products of labor for the two goods.
Home Production Possibilities Frontier L = 25 Amount of L for 1 bushel of wheat= 1/4, Amount of L for 1 yard of cloth = 1/2 FIGURE 2-1
2 Ricardian Model The Home Country • Opportunity Cost. • What is the cost of producing one more unit of wheat? • What is the cost of producing one more unit of cloth? • What happens when you move one unit of labor from producing wheat and into producing cloth? • What happens when you do the opposite? • What is the slope of the PPF? • Returning to the previous slide….
Home Production Possibilities Frontier MPLW= 4, MPLC= 2, L = 25 1/MPLW= 1/4, 1/MPLC= 1/2 FIGURE 2-1 The Home PPF is a straight line between 50 yards of cloth and 100 bushels of wheat. The slope of the PPF equals the negative of the opportunity cost of wheat. Equivalently, the magnitude of the slope can be expressed as the ratio of the marginal products of labor for the two goods.
2 Ricardian Model The Home Country • Home Indifference Curve Map. We will use indifference curves to determine consumer demand. • All points on an indifference curve have the same level of utility for our consumers. • Equivalently, each indifference curve shows the combinations of two goods, such as wheat and cloth, that a person or economy could consume and be equally satisfied. • Points on higher indifference curves have higher utility.
2 Ricardian Model Home Indifference Curve Home Equilibrium with No Trade FIGURE 2-2 Points A and B lie on the same indifference curve and give the Home consumers the level of utility U1. The highest level of Home utility on the PPF is obtained at point A, which is the no-trade equilibrium. Point D is also on the PPF but would give lower utility. Point C represents a higher utility level but is off of the PPF, so it is not attainable in the absence of international trade.
2 Ricardian Model The Home Country • Show this (Point A) is a market equilibrium • Firms: their objective, their decision rule • Consumer-workers: their objective, their decision rule • Will be showing there exist prices and wages such that there is a market equilibrium (labor market, cloth market, wheat market) that is the point A we have just identified.
2 Ricardian Model The Home Country • Wages and the firms • In competitive markets firms hire workers up to the point at which the hourly wage equals the value of one more hour of production. (Firms reason on the margin to maximize total profit.) • The value of one more hour of labor equals the amount of goods produced in that hour (MPL) times the price of the good (P). • Labor hired up to the point where wage W equals P • MPL for each industry: • PW • MPLW = W • PC • MPLC = W
Connection to chapters 3 and 4. • Labor hired up to the point where wage W equals P • MPL for each industry: • PW • MPLW = W • PC • MPLC = W • These profit-maximization conditions will also apply in Specific Factors (chapter 3) and the Heckscher-Ohlin model (chapter 4) models of trade.
2 Ricardian Model The Home Country • Wages and the workers • Again, from previous slide, the firms’ profit-maximization conditions: • PW • MPLW = W • PC • MPLC = W • Why aren’t we saying there are different wages depending on what you do? • Think about the decision of a worker about where to work. • Workers will choose to work where wages are highest. • Therefore, if there are workers employed in both industries it must be because wages are the same in both industries.
2 Ricardian Model The Home Country • Wages versus Real Wages • Workers get paid the value of their marginal product • W = P • MPL in each product market • And that wage W is the same regardless of which product a worker makes. • Rearranging, they get paid, • W/P = MPL in each product market • In real terms (not dollar terms) workers are paid their marginal product.
2 Ricardian Model The Home Country • Wages, towards equilibrium • We can use the equality of the wage across industries to obtain the following pair of equations: • PW• MPLW= W • PC• MPLC = W • By rearranging terms, we see that • PW/PC= MPLC/MPLW • The right-hand side of this equation is the slope of the production possibilities frontier (the opportunity cost of obtaining one more bushel of wheat). • The left-hand side of the equation is the relative price of wheat.
2 Ricardian Model The Home Country • Summarizing: Opportunity Cost and Prices • The slope of the PPF reflects the opportunity cost of producing one more bushel of wheat. • Under perfect competition the opportunity cost of wheat should also equal the relative price of wheat. • Relative price reflects the opportunity cost of a good.
2 Ricardian Model Returning to Figure 2-2 Home Equilibrium with No Trade FIGURE 2-2 If the relative price for wheat is the same as the slope of the PPF then the firms are in equilibrium anywhere along the PPF. If the relative price is higher they will only produce wheat. If it is lower they will produce only cloth. But which of these results in a choice by consumers that is in harmony with those production plans?
What bundles can consumers afford? • Who is receiving income to spend on cloth and wheat? • Who are the consumers? • In every closed (no trade) economy all revenue earned by the firms (GDP) flows through as expenditures on inputs or profit for the firms (GNI) • Payments (income) to factors of production (e.g., labor) • Profit (income to owners) • Because income equals revenue consumers have just enough income to purchase what is produced. (GNE) • But they also imagine they exchange wheat for cloth at the relative price. • This means their budget line coincides with the PPF. • This result carries over to chapters 3 and 4.
2 Ricardian Model Returning to Figure 2-2 Home Equilibrium with No Trade FIGURE 2-2 Again, if the relative price for wheat is the same as the slope of the PPF then the firms are in equilibrium anywhere along the PPF. But which of these results in a choice by consumers that is in harmony with those production plans? Answer: The PPF with no trade is also the consumers budget line.
2 Ricardian Model Returning to Figure 2-2, continued Home Equilibrium with No Trade FIGURE 2-2 Under the “constant marginal product” assumption of the Ricardian model the point on the PPF the market economy operates on is determined entirely by the consumers, not the firms. (Why is that?)
2 Ricardian Model The Foreign Country ( * denotes “foreign”) • Assume a Foreign worker can produce one bushel of wheat or one yard of cloth. • Suppose MPL*W= 1, MPL*C = 1 • Recall in Home Country, MPLW= 4, MPLC= 2 • We say Home has an absolute advantage in both goods. (So why trade? We’ll get to that soon.) • Assume there are 100 workers available in Foreign. • If all workers were employed in wheat they could produce 100 bushels. • If all workers were employed in cloth they could produce 100 yards.
2 Ricardian Model The Foreign Country Foreign Production Possibilities Frontier FIGURE 2-3 The Foreign PPF is a straight line between 100 yards of cloth and 100 bushels of wheat. The slope of the PPF equals the negative of the opportunity cost of wheat, that is, the amount of cloth that must be given up (1 yard) to obtain 1 more bushel of wheat.
2 Ricardian Model Comparative Advantage • A country has a comparative advantage in a good when it has a lower opportunity cost of producing that good than another country. • By looking at the chart we can see that Foreign has a comparative advantage in producing cloth. Home has a comparative advantage in producing wheat.
2 Ricardian Model The Foreign Country Comparative Advantage FIGURE 2-4 Foreign Equilibrium with No Trade The highest level of Foreign utility on the PPF is obtained at point A*, which is the no-trade equilibrium.
3 Determining the Pattern of International Trade International Trade Equilibrium What happens when goods are traded between Home and Foreign? We will see the country’s no-trade relative price compared to the other’s determines which product it will export and which it will import. Recall: The no-trade relative price equals its opportunity cost of production. The trade pattern of exports and imports will be determined by the opportunity costs of production in each country—their comparative advantage.
3 Determining the Pattern of International Trade International Trade Equilibrium The relative price of cloth in Foreign is P*C/P*W= 1 bushel of wheat. The relative price of cloth in Home is PC/PW = 2 bushels of wheat. Therefore Foreign would want to export their cloth to Home—they can make it for 1 bushel of wheat and trade it for more than 1 bushel of wheat from Home.
3 Determining the Pattern of International Trade International Trade Equilibrium, continued • The relative price of cloth in Foreign is P*C/P*W= 1 bushel of wheat. • The relative price of cloth in Home is PC/PW = 2 bushels of wheat. • The opposite is true for Home: Home would want to produce wheat for export—we can make at a cost of ½ yard of cloth and trade it for more than ½ yard of cloth from Foreign. • There is a “double coincidence of wants.” The countries want to be on opposite sides of the exchange. • Conclusion: Both countries export the good for which they have the comparative advantage. • When would there be no trade in the Ricardian model? • Answer: When the opportunity costs are the same across countries (as would occur, for example, if they had access to same technology).
3 Determining the Pattern of International Trade International Trade Equilibrium • Adjustment to equilibrium • As Home exports wheat, quantity of wheat sold at Home falls. • The price of wheat at Home is bid up. • More wheat goes into Foreign’s market. • The price of wheat in Foreign falls. • As Foreign exports cloth, the quantity sold in Foreign falls, and the price in Foreign for cloth rises. • The price of cloth at Home falls.
3 Determining the Pattern of International Trade International Trade Equilibrium • The two countries are in an international trade equilibriumwhen the relative price of wheat is the same in the two countries. If they aren’t equal someone can gain simply by arbitraging (buying low and selling high) and that will bring relative prices into equality. • This means that the relative price of cloth is also the same in both countries. • It’s also necessary that quantities are in balance.
3 Determining the Pattern of International Trade International Trade Equilibrium To completely understand the international trade equilibrium, we are interested in two issues: Determining the relative price of wheat (or cloth) in the trade equilibrium. Seeing how the shift from the no-trade equilibrium to the trade equilibrium affects production and consumption in both Home and Foreign.
3 Determining the Pattern of International Trade International Trade Equilibrium The relative price of wheat in the trade equilibrium will be in between the no-trade price in the two countries. Suppose I tell you the free-trade price ratio PW /PCis 2/3. This is between the price of ½ in Home and 1 in Foreign. We can now take this price and see how trade changes production and consumption in each country. The world price line shows the range of consumption possibilities that a country can achieve by specializing in one good and engaging in international trade.
3 Determining the Pattern of International Trade International Trade Equilibrium Change in Production and Consumption Home Equilibrium with Trade FIGURE 2-5 (1 of 3) With a world relative price of wheat of 2/3, Home production will occur at point B. Through international trade, Home is able to export each bushel of wheat it produces in exchange for 2/3 yard of cloth.
3 Determining the Pattern of International Trade International Trade Equilibrium Change in Production and Consumption Home Equilibrium with Trade (continued) FIGURE 2-5 (2 of 3) As wheat is exported, Home moves up the world price line BC. Home consumption occurs at point C, at the tangent intersection with indifference curve U2, since this is the highest possible utility curve on the world price line.
3 Determining the Pattern of International Trade International Trade Equilibrium Change in Production and Consumption FIGURE 2-5 (3 of 3) Home Equilibrium with Trade (continued) Given these levels of production and consumption, we can see that total exports are 60 bushels of wheat in exchange for imports of 40 yards of cloth and also that Home consumes 10 fewer bushels of wheat and 15 more yards of cloth relative to its pre-trade levels.
3 Determining the Pattern of International Trade International Trade Equilibrium International Trade Home obtains a higher utility with international trade than in the absence of international trade (U2 is higher than U1); the finding that Home’s utility increases with trade is our first demonstration of the gains from trade, by which we mean the ability of a country to obtain higher utility for its citizens under free trade than with no trade. FIGURE 2-5 (revisited) EX = (2/3)60, IM = 40, TB = EX – IM = 40 – 40 = 0
3 Determining the Pattern of International Trade International Trade Equilibrium Pattern of Trade and Gains from Trade FIGURE 2-6 (1 of 2) Foreign Equilibrium with Trade With a world relative price of wheat of 2/3, Foreign production will occur at point B*. Through international trade, Foreign is able to export 2/3 yard of cloth in exchange for 1 bushel of wheat, moving down the world price line.
3 Determining the Pattern of International Trade International Trade Equilibrium Pattern of Trade and Gains from Trade FIGURE 2-6 (2 of 2) Foreign Equilibrium with Trade (continued) Foreign consumption occurs at point C*, and total exports are 40 yards of cloth in exchange for imports of 60 bushels of wheat. Relative to its pre-trade wheat and cloth consumption (point A*), Foreign consumes 10 more bushels of wheat and 10 more yards of cloth. EX = (2/3)60, EX* = 40, EX = EX* = 40 IM* = (2/3)60, EX* = 40, TB* = EX* – IM* = 40 – 40 = 0