Download
1 / 14
140 likes | 267 Views
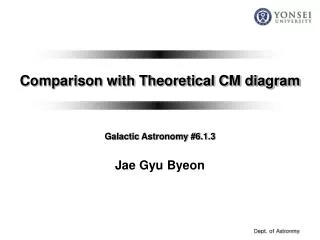
Comparison with Theoretical CM diagram. Galactic Astronomy #6.1.3 Jae Gyu Byeon. Isochrone. The Morphology of G.C. CMD : All star formed single epoch Choose initial abundances for the chemical element For heavy element, initial helium abundance Evolve the population forward in time

E N D
Comparison with Theoretical CM diagram Galactic Astronomy #6.1.3 Jae Gyu Byeon
Isochrone • The Morphology of G.C. CMD : All star formed single epoch • Choose initial abundances for the chemical element • For heavy element, initial helium abundance • Evolve the population forward in time • Solving the stellar structure equation • Keeping track of the chemical evolution • For each step, calculate the luminosities and colors • The curve connecting all the stars in the CMD is called an “Isochrone” from the Greek for “same time”
Isochrone • If assumed initial chemical composition and stellar structure calculations is correct, • Comparing isochrones to observed sequences : Powerful tool • For measuring the ages of G.C • For testing our understanding of the basic physics of stellar structure. • Isochrones have been calculation for a wide range of different metallicities, age, and physical assumptions • Yonsei-Yale group, BASTI group, Victoria group
BASTI Isochrones α Enhanced Models Canonical Models Z = 0.01 Y = 0.259 [Fe/H] = -0.60 [M/H] = -0.25 η= 0.4
BASTI Isochrones α Enhanced Models Canonical Models Z = 0.001 Y = 0.246 [Fe/H] = -1.62 [M/H] = -1.27 η= 0.4
BASTI Isochrones α Enhanced Models Canonical Models η= 0.4 Red solid lines Z = 0.01 Y = 0.259 [Fe/H] = -0.60 [M/H] = -0.25 Blue solid lines Z = 0.001 Y = 0.246 [Fe/H] = -1.62 [M/H] = -1.27
Y2 Isochrones Scaled Solar Models Z = 0.02 Y = 0.27 [Fe/H] = 0.046 [α/H] = 0.0
Y2 Isochrones Scaled Solar Models Z = 0.001 Y = 0.232 [Fe/H] = -1.289 [α/H] = 0.0
Y2 Isochrones α Enhanced Models Z = 0.001 Y = 0.232 [Fe/H] = -1.758 [α/H] = 0.6
Y2 & BASTI Isochrones Scaled solar Models [α/H] = 0.0 Age = 0.1, 0.7, 2.0, 10 Gyr Y2 Isochrones Z = 0.02 Y = 0.27 [Fe/H] = 0.046 Red solid lines BASTI Isochrones Z = 0.0198 Y = 0.2743 [Fe/H] = 0.06 Blue solid lines
Y2 & BASTI Isochrones Scaled solar Models [α/H] = 0.0 Age = 0.1, 0.7, 2.0, 10 Gyr Y2 Isochrones Z = 0.001 Y = 0.232 [Fe/H] = -1.288 Red solid lines BASTI Isochrones Z = 0.001 Y = 0.246 [Fe/H] = -1.27 Blue solid lines
Comparision between Isochrone and RGB, HB • Unable to model accurately the deep convective layers and mass loss in giant star • The match between calculation and observation becomes rather poor • Vertical RGB to depend on metallicity • Most metal-poor clusters have the bluest RGBs • The line blanketing effects of heavy elements • Poorer for the RGB than it is for the MS and SGB • Still-later stages of stellar evolution : discrepancies grow
Comparision between Isochrone and RGB, HB • The Helium Flash • Instantaneous mass loss and a rearrangement of the structure • Not possible to follow the evolution of a star from the RGB on to the HB • This transition is treated in a semi-empirical manner. • MRG : Mass of tip of RGB • Mc : Mass of hydrogen-depleted helium • ΔM : lost a mass from its atmosphere • MHB = MRG - ΔM • A spred in values of ΔM • Probability distribution of MHB (Eq. 6.1)
Comparision between Isochrone and RGB, HB • These HB calculations explain the variation in HB color with cluster metallicity • This semi-empirical approach allows us to understand many of the features of the HB • The simple mass-loss model also fails to explain the differences in HB color seen in clusters with identical metallicities