Download
1 / 21
210 likes | 311 Views
This report provides insights into the CHORUS experiment proposal, experimental layout, analysis results, and the status of the second phase. It details the search for nm -> nt oscillation and explores the Dm2 region for neutrinos and possible dark matter contributions. The method involves the appearance of nt in a pure nm beam, using emulsion as a neutrino target and t detector. The analysis chain involves event selection, daughter candidate identification, scanning, and background reduction. The automatic emulsion scanning developed in Nagoya aids in hypothesis validation and background reduction. The report discusses the sources of background, the status of phase I analysis, and the advancements in phase II with a focus on oscillation and charm physics.

E N D
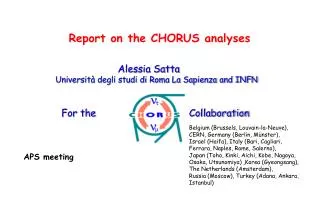
Report on the CHORUS analyses Alessia Satta Università degli studi di Roma La Sapienza and INFN For the Collaboration Belgium (Brussels, Louvain-la-Neuve), CERN, Germany (Berlin, Münster), Israel (Haifa), Italy (Bari, Cagliari, Ferrara, Naples, Rome, Salerno), Japan (Toho, Kinki, Aichi, Kobe, Nagoya, Osaka, Utsunomiya) ,Korea (Gyeongsang), The Netherlands (Amsterdam), Russia (Moscow), Turkey (Adana, Ankara, Istanbul) APS meeting
Contents • Chorus design • Experimental layout • Results from first phase of the analysis • Status of the second phase of the analysis
The experiment proposal • designed to search for nmntoscillation • proposal exclusion plot • aim: explore with high sensitivity the Dm2 region -suggested by the hypothesis of a large contribution of neutrinos to dark matter-
Conceptual design of the experiment • Search for the “appearance” of nt in an “pure” nm beam • the ntis detected through CC interactions oscillation signature = identify t as one of the products of a n interaction • the t identification is possible exploiting its short decay path (~ 1.5 mm at CHORUS energy) • use of emulsion (-1 mm spatial resolution) as neutrino target and t detector + electronicdetector to help distinguishing t from background
CHORUS apparatus Hadron spectrometer m spectrometer calorimeter Emulsion target + scintillating tracker
Analysis chain • Use electronic detector information. • Select events compatible with the t decay modes m-nt nm (BR 18 %)h-ntnpo (BR 50 %) • Select the events with at daughter candidate reduce the scanning load • daughter 1) m with P< 30 GeV/c candidates2) h with 1<Ph<20 GeV/c Preselection • Starting from the reconstructed events in the electronic detector thet daughter candidate tracks are followed back through emulsion to the neutrino vertex searching for a kink topology along their path Scanning Post-scanning • Validation of the nt hypothesis for the events with a kink topology, i.e. background reduction
Automatic Emulsion Scanning(developed in Nagoya) The major part of the scanning is fully automated: an hardware video processor (Track Selector) digitizes images (focused at 16 different depths). A track is found searching for grains coincidence in adjacent layers
Background sources SOURCE COMMON TO ALL APPEARANCE EXPERIMENT • The nt prompt component of the beam gives negligible background, less than 0.1 events is expected at the end of the analysis SOURCE TYPICAL OF CHORUS EXPERIMENT • The kink signature may originate from: • Short-lifetime particles decay – mainly charmed hadrons produced in neutrino or antineutrino interactions where the primary lepton is not identified • Hadrons-emulsion interactions if no nuclear recoil or break-up signs are detected (known as White Star Kink)
Results of phase I analysis Let’s look at the data ! NO CANDIDATE HAS BEEN FOUND Where 2.34 takes into account the systematic uncertainty (15%)
Chorus phase II • One year ago a second phase of the analysis has begun • New algorithms for reconstruction in electronic detector • New scanning method for secondary vertices detection (Net scan) • This second phase is focused both on oscillation and charm physics
CHORUS Phase II : net scan All track segments ( < 0.4 rad) in Fiducial volume: 1.5 x 1.5 mm2 x 8 plates Offline analysis of emulsion data Increase in efficiency ~ 2 , higher purity Reconstruct full vertex topology At least 2-segment connected tracks Track segments from 8 plates overlapped Eliminate passing-through tracks
Charm physics Charm hadrons similar lifetime to t so possible exploring also charm physics: direct detection of decay point and topology (unique feature in neutrino experiment) The purity of the automatic scanning analysis is so high that almost no manual scan is needed ! • D0 production rate Already published on a subsample (D0) / σ (CC) = 1.99 0.13 0.17 % • Inclusive charm studies Expected 4,000 neutrino-induced charm events Fragmentation fractions D0 : D+ : Ds+ : c+ B(c), Vcd, s(x), ... • Associated charm production • Exclusive channels • c absolute BR - QE c production E531 CHORUS
Outlook • First phase analysis is finished • A new MORE efficient phase is started using • the power automatic scanning technique Net scan • new off-line analysis algorithms • Goals of this Phase II : • reach the proposal sensitivity in oscillation search • Charm physics exploiting the chorus unique feature to be able to detect the decay topology event by event
WSK background evaluation • Few measurements available • Difficult to use because the whiteness depends from the emulsion composition and from the manual scanning rules Internal normalization • Definition of a signal free reference region (Ldecay >3plate ~ 2800 mm ) • Measurement of the WSK effective cross-section using CHORUS data in the reference region • Extrapolation in the signal region with the help of full MonteCarlo simulation • Automatic inclusion of the CHORUS efficiency
White Star Kink simulation • The hadron-emulsion interaction is simulated by FLUKA (A. Ferrari). • The simulation of the emulsion “response” to the hadron interactions is a critical point • It uses empirical criteria (b and range) to decide if a particle, a nucleus or a nuclear fragment outgoing from the interaction can be detected during the scanning Check with KeK data: good agreement
Comparison of WSK simulation and CHORUS data Using data in the reference region (26 events) check Pt distribution WSK simulation + DATA t h- ntnpo
Comparison of WSK simulation and CHORUS data (2) Using data in the reference region (26 events) check qkink distribution t h- ntnpo WSK simulation + DATA
Automatic scanning :phase I One emulsion stack = 36 plates piled-up along the beam direction Vertex plate localization Kink finding Vertex plate= where the track deseappeares Explore part of the vertex plate searching for a small I.P. track with the scan back one ( I.P.< 9 mm) The kink signature by I.P. is checked manually It contains the neutrino interaction or the decay point
Background at the 0m sample • Charm production and missed muon • from antineutrino bg =3.6 x 10 –6 / N located • from neutrino if the hadron produced in charm decay is wrongly reconstructed as negative bg =3.4 x 10 –5 / N located • Hadronic interaction in NC missed
missed Background at the 1m sample • Charm production and missed muon • from antineutrino • from neutrino if the muon produced in charm decay is wrongly reconstructed as negative • CC interactions when the primary muon is wrongly associated to an hadron that undergoes WSK interaction or to an hadron from charm decay


![[chorus] Amen Amen Amen [end Chorus]](https://cdn1.slideserve.com/2992977/slide1-dt.jpg)