What is Statistics
What is Statistics. Chapter 1. GOALS. What is meant by statistics? Understand why we study statistics. Explain what is meant by descriptive statistics and inferential statistics. Distinguish between a qualitative variable and a quantitative variable.


What is Statistics
E N D
Presentation Transcript
What is Statistics Chapter 1
GOALS • What is meant by statistics? • Understand why we study statistics. • Explain what is meant by descriptive statistics and inferential statistics. • Distinguish between a qualitative variable and a quantitative variable. • Describe how a discrete variable is different from a continuous variable. • Distinguish among the nominal, ordinal, interval, and ratio levels of measurement.
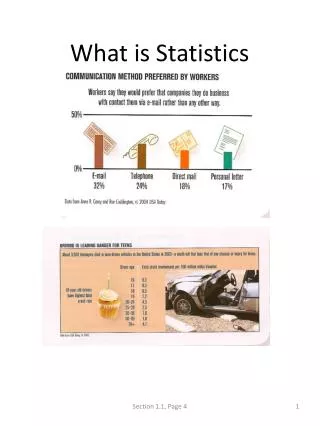
What Is Meant By Statistics? • Common meaning: • Numerical information such as: • Mean time waiting on hold for technical support is 17 minutes • In a recent poll, 21% of respondents approved of the President’s policies • Statistic: One figure • Statistics: more than one figure
What Is Meant By Statistics? • Statistics is interested in what is a typical value and how much variation there is in the data • Typical value: • Some sort of average (Mean, Median, Mode) • Variation • How reliable is the average • How clustered are the data points around the mean
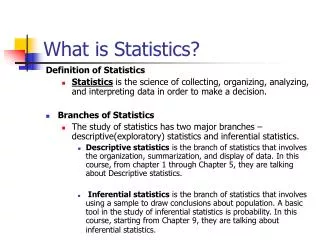
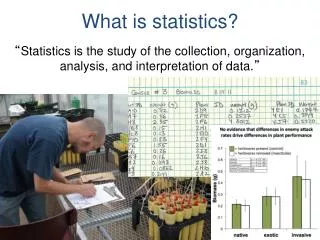
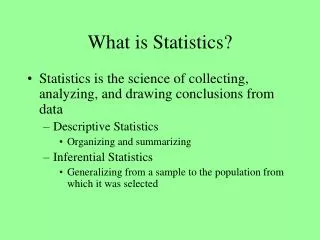
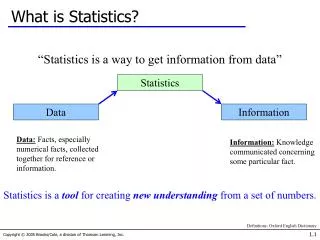
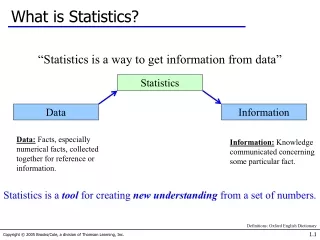
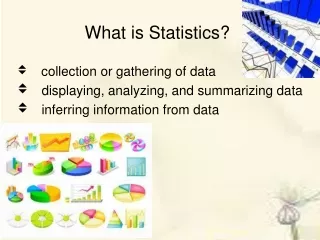
What is Meant by Statistics? Statisticsis the science of collecting, organizing, presenting, analyzing, and interpreting numerical data to assist in making more effective decisions.
Understand why we study statistics • Because numeric and non-numeric data are everywhere • In marketing, accounting, finance, economics, politics, sciences, and elsewhere, there are statistics • We need to be able to understand statistics when we encounter them • We need to not be tricked by misleading statistics • We need to use statistics to help us make decisions under future uncertainty
Who Uses Statistics? Statistical techniques are used extensively by marketing, accounting, quality control, consumers, professional sports people, hospital administrators, educators, politicians, physicians, etc...
Types of Statistics – Descriptive Statistics Descriptive Statistics - methods of organizing, summarizing, and presenting data in an informative way.
Descriptive Statistics EXAMPLE 2: According to Consumer Reports, General Electric washing machine owners reported 9 problems per 100 machines during 2001. The statistic 9 describes the number of problems out of every 100 machines.
Descriptive Statistics EXAMPLE 3: Pie Chart (chapter 2) For Running Shoes Sold At Big 5 Sports
Descriptive Statistics EXAMPLE 4: Frequency Distribution (chapter 2)
Types of Statistics – Descriptive Statistics • Inferential Statistics definition 1: The methods used to estimate a property of a population on the basis of a sample. • Inferential Statistics definition 2: A decision, estimate, prediction, or generalization about a population, based on a sample.
A populationis a collection of all possible individuals, objects, or measurements of interest. A sample is a portion, or part, of the population of interest Population versus Sample
Inferential Statistics Example 1: TV networks constantly monitor the popularity of their programs by hiring Nielsen and other organizations to sample the preferences of TV viewers.
Example 2: Wine tasters sip a few drops of wine to make a decision with respect to all the wine waiting to be released for sale. Example 3: The accounting department of a large firm will select a sample of the invoices to check for accuracy for all the invoices of the company. Inferential Statistics
Descriptive Statistics Or Inferential Statistics? • There are a total of 42,796 miles of interstate highways in the United States • Auditors take a sample of a firm’s invoices in order to assess the magnitude of reliability of the accounting invoicing system
Types of Variables • Qualitative or Attribute variable - the characteristic being studied is nonnumeric. • EXAMPLES: Gender, type of automobile owned, state of birth, eye color are examples. • Qualitative data are usually summarized in graphs or bar charts • (Nominal or ordinal level of measurement)
Types of Variables • Quantitative variable - information is reported numerically. • EXAMPLES: balance in your checking account, minutes remaining in class, or number of children in a family. • Quantitative variables can be classified as either Discrete or Continuous.
Quantitative Variables - Classifications • Discrete variables: can only assume certain values and there are usually “gaps” between values. • EXAMPLE: the number of bedrooms in a house, or the number of hammers sold at the local Home Depot (1,2,3,…,etc).
Quantitative Variables - Classifications Continuous variable can assume any value within a specified range. EXAMPLE: The pressure in a tire, the weight of a pork chop, or the height of students in a class. Usually is measured (accuracy depends on measuring instrument) Money is often categorized as a continuous variable (even though you can’t count between pennies) 20
Distinguish Between A Qualitative Variable And A Quantitative Variable • Colors of M & M candies? • Amount of money in your retirement account? • Score on test? • Type of bike you own?
Four Levels of Measurement • Levels of measurement dictate: • The calculations that can be done to summarize & present the data • The statistical tests that can be preformed • Nominal level – No order • Ordinal level – Order but no set distance between levels • Interval level - Order with set distances between levels, zero just a point on the scale, no division • Ratio level - Order with set distances between levels, inherent zero starting point, division OK
Nominal Level • Nominal level - data that is classified into categories and cannot be arranged in any particular order. • EXAMPLES: Eye color, gender, car make • Observations of a qualitative variable can only be classified and counted. There is no particular order to the labels. • Nominal level properties: • Data categories are represented by labels or names. • Even when the labels are numerically coded, the data categories have no logical order.
Ordinal Level • Ordinal level – involves data arranged in some order, but the differences between data values cannot be determined or are meaningless. • EXAMPLE: During a taste test of 4 soft drinks, Mellow Yellow was ranked number 1, Sprite number 2, Seven-up number 3, and Orange Crush number 4. • EXAMPLE: How do you rate your instructor? • EXAMPLE: Order of finish in race. • Ordinal level properties: • Data classifications are represented by sets of labels or names (high, medium, low or very good, good, poor) that have relative values. • Because of the relative values, the classified data can be ranked or ordered.
Ordinal Level During a taste test of 4 soft drinks, Coca Cola was ranked number 1, Dr. Pepper number 2, Pepsi number 3, and Root Beer number 4.
Interval level: One category is higher than another (Ordered). There is a constant unit of measurement. Zero is just a point on the scale; or there is no natural zero point. Division of two numbers does not make sense. Scale or rank are good examples EXAMPLE: Temperature on the Fahrenheit scale. Zero is just a point on the scale. EXAMPLE: Shoe size and dress size. There is no natural zero point EXAMPLE: Years in which Whole Foods Market Inc. stock split. Division of 1992 and 1993 does not make sense. EXAMPLES: Rank of Indi 500 results, Test scores. Interval Level
Interval Level • Interval level properties: • Data classifications are ordered according to the amount of the characteristic they possess. • Equal differences in the characteristic are represented by equal differences in the measurement. • The increment amount up or down is always the same.
Ratio Level • Ratio level - the interval level with an inherent zero starting point. Differences and ratios are meaningful for this level of measurement. • Practically all quantitative data are the ratio level of measurement. EXAMPLES:Monthly income of surgeons, distance traveled by Sales Rep. per month, Bank account amount, weight, height, wages, units of production….
Ratio Level • Bank account dollars • Zero is not just a point on the scale, it is the inherent starting point. • Zero means that you don’t have any money. • Zero means that there is a complete absence of money. • Division has meaning: • Starting balance = $1000. • Ending balance = $1500. • Decimal equivalent change = 1500/1000-1 = .50.
Ratio Level • Ratio level properties: • Data classifications are ordered according to the amount of the characteristics they posses. • Equal differences in the characteristics are represented by equal differences in the number assigned to the classification. • The zero point is the absence of the characteristic and the ratio between two numbers is meaningful.
Summary of the Characteristics for Levels of Measurement (example 1)
Summary of the Characteristics for Levels of Measurement (example 2) Levels of Data Nominal Ordinal Interval Ratio Data may only be classified (no order) Data are ranked Meaningful differences between values Meaningful 0 point & ratio between values • Jersey # • Make of car • Team standings • in the Pac 10 • CPA exam rank • Temperature • Shoe size • Score on Test • Checkbook Bal. • Stock values