Download
1 / 10
100 likes | 178 Views
Statistics is the study of collecting, organizing, analyzing, and interpreting data. Discover how to answer questions about student heights using measures like mean, standard deviation, and standard error in various locations like a class or Michigan. Explore differences between bean types' lengths using statistical methods.

E N D
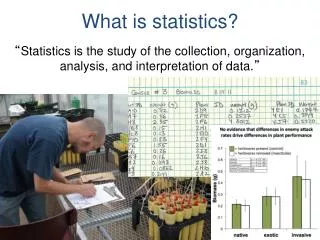
What is statistics? “Statistics is the study of the collection, organization, analysis, and interpretation of data.”
How tall are students in this class? How can we answer this question? What data would you need to collect?
How tall are students in this class? Mean = 69.30 MEAN:
How tall are students in this class? S = 4.84 STANDARD DEVIATION:
Mean = 8.88 StdDev = 1.90 Mean = 9.02 StdDev = 3.77
How tall are students in Michigan? How can we answer this question? Would you need a different sample compared to our previous question?
How tall are students in Michigan? SE = 0.80 STANDARD ERROR:
SQUARED! Half the class gets bean type 1, half the class bean type 2 Do the two types of beans have different lengths?
MEAN: STANDARD DEVIATION: STANDARD ERROR: