Supply
Supply. The analysis of the supply of produced goods has two parts:. An analysis of the supply of the factors of production to households and firms. An analysis of why firms transform those factors of production into usable goods and services. Law of Supply. Law of Supply

Supply
E N D
Presentation Transcript
Supply • The analysis of the supply of produced goods has two parts: • An analysis of the supply of the factors of production to households and firms. • An analysis of why firms transform those factors of production into usable goods and services.
Law of Supply • Law of Supply • As the price of a product rises, producers will be willing to supply more. • The height of the supply curve at any quantity shows the minimum price necessary to induce producers to supplythat next unit to market. • The height of the supply curve at any quantity also shows the opportunity cost ofproducing the next unitof the good.
The Law of Supply • The law of supply is accounted for by two factors: • When prices rise, firms substitute production of one good for another. • Assuming firms’ costs are constant, a higher price means higher profits.
The Law of Supply • The law of supply states that there is a positive relationship between price and quantity of a good supplied. • This means that supply curves typically have a positive slope.
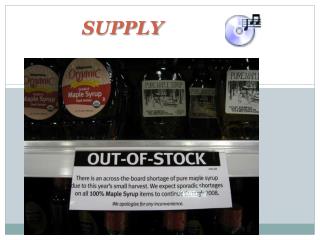
Supply Schedule • A supply schedule shows how much of a good or service would be supplied at different prices.
Supply curve, S Supply Curve Price of coffee beans (per pound) A supply curve shows graphically how much of a good or service people are willing to sell at any given price. $2.00 1.75 As price rises, the quantity supplied rises. 1.50 1.25 1.00 0.75 0.50 0 7 9 11 13 15 17 Quantity of coffee beans (billions of pounds)
What Causes a Supply Curve to Shift? • Changes in input prices • An input is a good that is used to produce another good. • Changes in the prices of related goods and services • Changes in technology • Changes in expectations • Changes in the number of producers • Weather
An Increase in Supply • The entry of Vietnam into the coffee bean business generated an increase in supply—a rise in the quantity supplied at any given price. • This event is represented by the two supply schedules—one showing supply before Vietnam’s entry, the other showing supply after Vietnam came in.
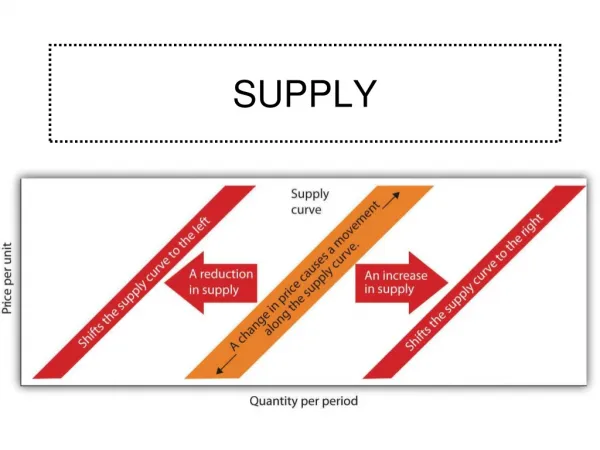
S 2 An Increase in Supply Price of coffee beans (per pound) S 1 A shift of the supply curve is a change in the quantity supplied of a good at any given price. $2.00 A movement along the supply curve… 1.75 1.50 1.25 1.00 … is not the same thing as a shift of the supply curve 0.75 0.50 0 7 9 11 13 15 17 Quantity of coffee beans (billions of pounds)
Change in price of a good or service leads to Change in quantity supplied(Movement along the curve). Change in costs, input prices, technology, or prices of related goods and services leads to Change in supply (Shift of curve). A Change in Supply Versusa Change in Quantity Supplied To summarize:
Supply, Demand and Equilibrium • Equilibrium in a competitive market: when the quantity demanded of a good equals the quantity supplied of that good. • The price at which this takes place is the equilibrium price (a.k.a. market-clearing price): • Every buyer finds a seller and vice versa. • The quantity of the good bought and sold at that price is the equilibrium quantity.
Market Equilibrium • Only in equilibrium is quantity supplied equal to quantity demanded. • At any price level other than P0, the wishes of buyers and sellers do not coincide.
Surplus Price of coffee beans (per pound) There is a surplus of a good when the quantity supplied exceeds the quantity demanded. Surpluses occur when the price is above its equilibrium level. Supply $2.00 1.75 Surplus 1.50 1.25 E 1.00 0.75 0.50 Demand 0 7 8.1 10 11.2 13 15 17 Quantity of coffee beans (billions of pounds) Quantity demanded Quantity supplied
Shortage Price of coffee beans (per pound) There is a shortage of a good when the quantity demanded exceeds the quantity supplied. Shortages occur when the price is below its equilibrium level. Supply $2.00 1.75 1.50 1.25 E 1.00 0.75 Shortage 0.50 Demand 0 7 9.1 10 11.5 13 15 17 Quantity of coffee beans (billions of pounds) Quantity supplied Quantity demanded
Market Equilibrium Price of coffee beans (per pound) Market equilibrium occurs at point E, where the supply curve and the demand curve intersect. Supply $2.00 1.75 1.50 1.25 Equilibrium price Equilibrium E 1.00 0.75 0.50 Demand 0 7 10 13 15 17 Quantity of coffee beans (billions of pounds) Equilibrium quantity