Supply
Supply. Unit 2 – Lesson 2. What is Supply?. The economic concept of supply refers to the relationship between price and quantity supplied . Generally as producers receive a higher price, they produce more.

Supply
E N D
Presentation Transcript
Supply Unit 2 – Lesson 2
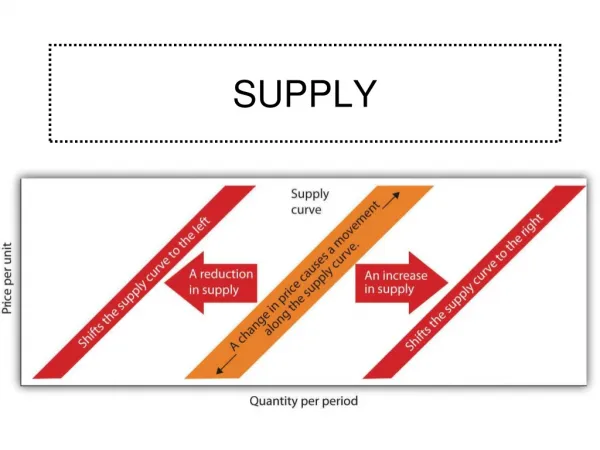
What is Supply? The economic concept of supply refers to the relationship between price and quantity supplied. Generally as producers receive a higher price, they produce more. In addition the higher the price is the more businesses are attracted to produce the product.
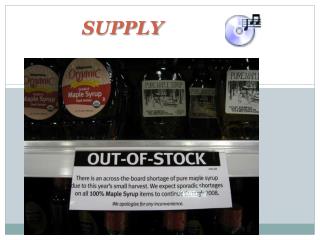
Supply of Butter As you can see, as the price decreases, the amount supplied decreases. At a certain price it is no longer financially feasible for a producer to make a product and they will shut-down
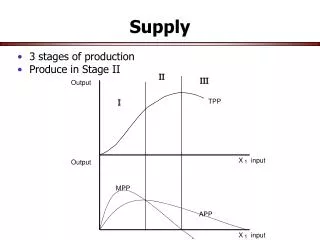
Shifts in Supply - Increase • Just like the demand curve, the supply curve can be shifted • Factors which may increase the supply of a product at all prices include: • the introduction of more efficient production technology, • cheaper and/or more readily available raw materials to produce the product
Example Assume the dairy has come up with a new technology that allows them to produce more cheaply The chart illustrates how supply has increased at all prices levels and has even allowed the company to keep producing at a lower price than before.
Shifts in Supply - decrease Again, as with the demand curve, factors may lead to a decrease in the quantity supplied at all price levels. These factors may include: a) more expensive and/or a decrease in the quantity of available raw materials, b) a decrease
Scenario The chart illustrates how supply has decreased at all prices levels and how the diary must stop production at a higher price level than before.. The outbreak of a disease among the dairy cow population leads to a decrease in milk supply so less is available for butter production and at a higher price. The quantity supplied is lower at all price levels.
Homework You are the president of an oil company. A war in the Middle East has caused higher oil prices. The amount of oil your company is supplying is almost at capacity and the land from which you are drilling oil and your refineries are producing as much oil as they can. You want to increase your oil producing capacity in order to take advantage of the higher prices and increase your profits. Write a paragraph describing at least three ways that you could increase your capacity for the amount of oil you are supplying to the market.