Understanding the Law of Supply and Market Equilibrium
The Law of Supply states that, holding other factors constant, an increase in the price of a good results in an increase in the quantity supplied. This relationship can be visualized through supply schedules and curves, which illustrate changes in supply due to various factors like input costs, seller expectations, and the number of sellers. Additionally, market equilibrium occurs where quantity supplied equals quantity demanded, and shifts in supply can lead to changes in equilibrium prices. Understanding these concepts is crucial for analyzing market dynamics.

Understanding the Law of Supply and Market Equilibrium
E N D
Presentation Transcript
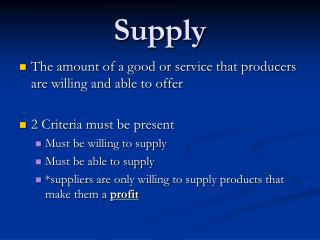
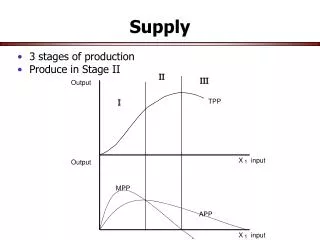
Supply • behavior of sellers • relationship between • quantity supplied of a good • price • holding other factors constant
Law of Supply If the price of a good then the Qs holding other things constant!!!
Why? • Holding costs constant • higher price means higher profit margin
Supply Schedule P Qs $2.00 3 $1.50 2 Price = $/bottle Qs = bottles/day $1.00 1 $.50 0
S Supply curve P 2 1.5 1 .5 Qs 0 1 2 3 4
Individual supply • supply curve for 1 supply • market supply** • supply curve for all sellers • add up individual Qs for each price
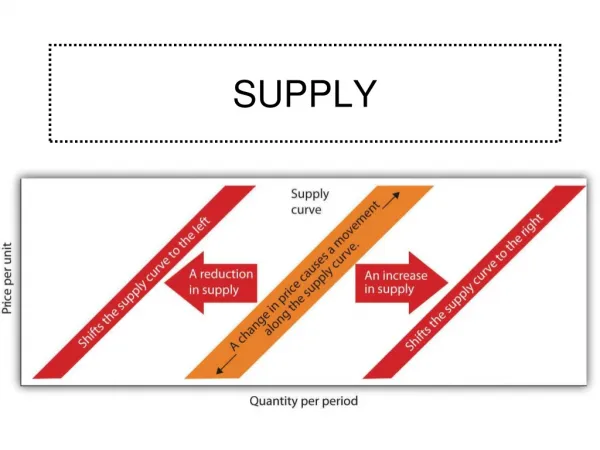
Changes in Supply • if other factors do change, • change in supply • shift to a new supply curve
increase in supply • increase in Qs at every price • supply curve shifts to the right
S S’ P Qs
decrease in supply • decrease in Qs at every price • supply curve shifts to the left
S’’ S P Qs
Factors affecting supply • Cost of inputs • prices of related goods • seller expectations • # of seller • productivity
Cost of inputs • As input prices get higher, supply decreases • example: increase in cost of • bottles • labor • electricity
Prices of related goods • Substitutes in production • a good that can be made instead of bottled water e.g. bottled tea • If price of bottled tea increases, switch to tea production, supply of bottled water falls
Complements in production • good that is produced with other good • e.g. Beef & leather • if price of beef rises, • Qs of beef rises, • & supply of leather rises
Seller expectations • Expect input prices to rise in future • increase supply today • expect price of good to rise in future • decrease supply today
# of sellers • As more sellers supply good, • market supply increases
Productivity • Amount of output per unit of input • bottles of water per hour of labor • Increase in productivity lowers cost • increases supply • what makes productivity increase? • Technology • human capital
Important!! • Change in supply -- occurs when other factors change -- shift to a new supply curve (right or left) • change in supply -- NOT caused by change in price of the good
Change in quantity supplied • -- occurs when prices change • -- movement along existing supply curve
P S Qs Change in Qs
S’’ S Change in Supply P Qs
Market Equilibrium • What will be the price of bottled water? • Price at which Qs = Qd -- equilibrium price -- equilibrium quantities
S $10 Equilibrium D 10 Market for Bottled Water P Q (millions bottles per day)
Why is this an equilibrium? • If Qs > Qd • surplus • price falls until Qs = Qd • If Qs < Qd • shortage • price rises until Qs = Qd
Changes in equilibrium • If supply and/or demand changes (shifts left or right), then equilibrium will change too.
Example 1 • Market for bottled water • price of plastic bottles rises • what happens to equilibrium?
Which curve is affected? • buyers or sellers? • Supply curve • bottles are an input
Increase or decrease in supply? • Increase in cost of input • supply decreases • shift LEFT
S’ P S Equilibrium: $10 P Q D Q 10 (millions bottles per day)
note • Change in supply causes change in equilibrium price BUT • Change in price does NOT cause a change in supply
Example 2 • Market for bottled water • sugar is found to be harmful to health • what happens to equilibrium?
Which curve is affected? • Demand curve • health concerns increase preferences for water
Increase or decrease in demand? • Increase in preference for water • demand increases • shift RIGHT
P S Equilibrium: $10 P D’ Q D Q 10 (millions bottles per day)
Example 3 • Market for bottled water • incomes fall & sellers expect utilities to rise
Which curve is affected? • Demand curve • income falls • Supply curve • seller expectations change • expect costs to rise
Increase or decrease? • Demand decreases (left) • income falls & bottled water is normal good • Supply increases (right) • make more water today before costs go up
P S S’ Equilibrium: P Q ? D D’ Q (millions bottles per day)
Example 4: Leather sandals Market for leather sandals A. Mad cow disease -- must destroy 20% of herds • what happens to equilibrium
S P S’ Supply decreases P increases Q decreases D Q
B. PETA • campaign against leather products • what happens to equilibrium?
P S demand decreases P decreases Q decreases D D’ Q
Example 5: Natural Gas Prices • Winter 2000-2001 prices increased over 100% • why?
3 possible causes: • 1. Supply decreases • or • 2. Demand increases • or • 3. both
S’ S P Decrease in Supply D Q
Why would S fall? • regulation -- tougher to drill -- increase costs • hot summer (2000) -- depletes inventories
S P Increase in Demand D’ D Q
Why would D rise? • booming economy (2000) • EPA rules • -- fewer coal plants, more gas plants • cold winter