Download
1 / 17
170 likes | 193 Views
Explore the factors impacting student enrollment at Marshall Public Schools, including open enrollment, free/reduced counts, special education demographics, and minority student populations. Learn about class sizes, staffing guidelines, and financial allocations across different funds.

E N D
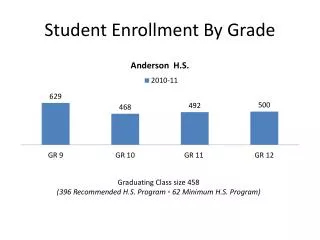
Student Enrollment Student count is what drives a majority of our revenue. The district has benefited over the past few years with increasing enrollment and we feel this should remain fairly stable for the foreseen future.
Another factor that drives our enrollment numbers either up or down is open enrollment. Keep in mind that these numbers are what is reported in our MARRS student system and may differ from the final MDE numbers Below are the number of students who attended Marshall Public Schools from neighboring school districts. This number includes open enrollment and high school tuition students. Note -MATEC is not included in the below table. In addition to the below numbers MATEC enrolls 35 students whose resident district is not Marshall. Below are the number of Marshall Public School resident students who attend schools in other school districts through the open enrollment option.
The next several set of tables will share information pertaining to the demographics of our student population. Areas such as free/reduced, minority student populations, and special education. These counts also drive different revenue and expenditures. Free & Reduced Student Counts: The below table represents our end of year free/reduced percent. Each year we see a gradual increase in our free/reduced population. Special Education Student Demographics: The chart below includes information detailing the number of resident students eligible for services for each school year. The district experienced an increase in identified special education students each year.
Minority Student Demographics: As we are aware, our English Learner (EL) population continues to increase. In 2017-2018 we reported 412 students as receiving EL services. In 2018-2019 its been reported that 434 students are receiving services. In the below figure, you will see the variety of home languages spoken within our schools/families.
Staffing and Class Sizes Staffing allocations are based on anticipated student needs, overall grade-level enrollments, staff/class size targets as identified and available classroom space. A component of this budget is a definition of manageable class sizes for the Marshall Public Schools, within classroom space limitations. Maintaining class sizes and student-to-staff ratios has been a priority for both the district and community we serve. Here are the school board approved guidelines, effective January of 2018 as compared to the projected student enrollment for 2019-2020 school year. Pre-School Staffing Guidelines At the pre-school level the ratio is 1 teacher for every 10 students. There is also a stipulation that there can be no more than 20 students in a classroom, with having 18 students as the ideal number. Elementary Staffing Guidelines Elementary level class size guidelines are calculated strictly on the basis of teacher/student ratio within the individual classroom. • Middle School Staffing Guidelines • Middle school staffing is a blended approach between primary level guidelines and secondary school staffing processes. These calculations are based on core classroom teachers. In addition, the middle school will staff exploratory/enrichment teachers shared equally among grades 5-8.
High School Staffing Guidelines • Secondary school staffing is determined by an allocation of staffing blocks and student sections at the high school building based on a targeted average class size of 28 students for grades 9-12. The high school administration determines the size of individual classes based on enrollment data, the needs of the building, and the strategic goals and objectives of the Marshall Public Schools. Class sizes can vary based on the type of class and the number of hours that it is taught. The secondary school does not receive additional non-licensed support for large classes. Special Education Staffing Guidelines Special education staffing is determined based upon overall caseload needs and demands. Caseloads may vary from teacher to teacher based on the overall identified needs, service times and other factors.
Debt Service Fund • Expenditure Difference • In 19/20 we will have an interest payment for: • Facilities Maintenance Bond (MS/PS Roof) $54,052 • Referendum Bond $550,019 • Revenue Difference • Payable 2019 levy we kept the excess debt revenue to assist with the referendum payment.