Comparison between aircraft and ground samples
80 likes | 198 Views
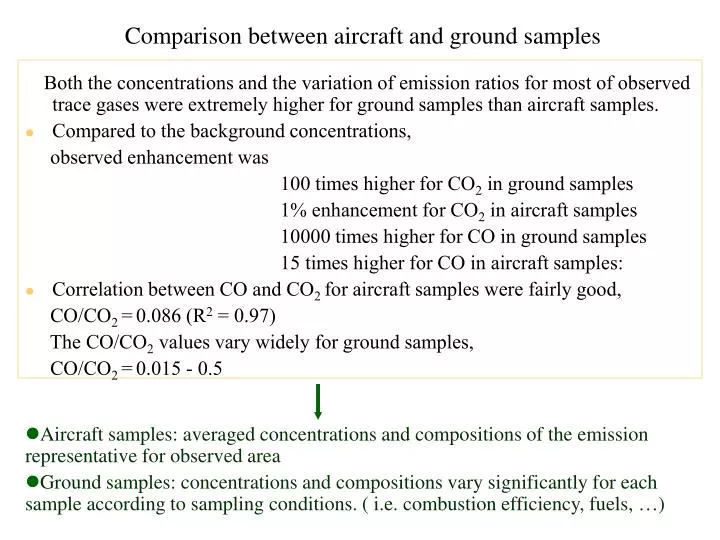
This study investigates the emission ratios and concentrations of trace gases collected from both aircraft and ground samples. Ground samples exhibit significantly higher emissions, with CO2 concentrations 100 times greater than background levels, compared to only 1% enhancement in aircraft samples. The correlation between CO and CO2 for aircraft was strong (R² = 0.97), while ground samples showed significant variability. Different sampling locations, such as Litchfield and Kakadu National Parks, underscore the influence of combustion efficiency and environmental conditions on emission ratios, especially for reactive compounds.

Comparison between aircraft and ground samples
E N D
Presentation Transcript
Comparison between aircraft and ground samples Both the concentrations and the variation of emission ratios for most of observed trace gases were extremely higher for ground samples than aircraft samples. • Compared to the background concentrations, observed enhancement was 100 times higher for CO2 in ground samples 1% enhancement for CO2 in aircraft samples 10000 times higher for CO in ground samples 15 times higher for CO in aircraft samples: • Correlation between CO and CO2 for aircraft samples were fairly good, CO/CO2 =0.086 (R2 = 0.97) The CO/CO2 values vary widely for ground samples, CO/CO2 =0.015 - 0.5 • Aircraft samples: averaged concentrations and compositions of the emission representative for observed area • Ground samples: concentrations and compositions vary significantly for each sample according to sampling conditions. ( i.e. combustion efficiency, fuels, …)
Sorghum Triodia Mangroves Floodplain Ground sampling sites Darwin Jabiru Kakadu National Park Litchfield National Park Sample Site ( Sept. 10, 1999 ) Nitmiluk National Park Sample Site ( Sept. 4, 1999 ) Katherine
Ground samples Aircraft samples Figure 1. Correlation plot for (a) ground samples and (b) aircraft samples. The red line shown in (a) is not the regression line but shows the same slope with the regression line shown in (b). Seven data points in (a), which deviate markedly from the line were excluded when comparing emission ratios for other compounds to lessen the effect of combustion efficiency difference.
Comparison of correlation plots from ground/aircraft samples
Comparison of emission ratios obtained from ground samples and aircraft samples obtained by BIBLE-B experiments ratio = 1 Reactivity :MIR (Maximum Incremental Reactivity) [ Carter W., CE-CERT, U. C. Riverside, 2000]
Estimation of the age of airmass observed by BIBLE-B Compare X/CO (emission ratios of NMHCs of different lifetimes) from ground samples and aircraft samples. Airmass age is derived from following equation assuming stability of CO during the transport. Airmass age = ln r・τ r : X/CO τ: lifetime of X Altitude range: 0-4km Considering OH oxidation as dominant sink process Assuming [OH]=2.7 x 10⁶ molecules cm-3 Estimated airmass age = *0.36 days ( 8 hours) *Depending heavily on [OH] assumption
Comparison of emision ratios obtained from aircraft samples obtained for biomass burning in Brasil ratio = 1
The effect of airmass age difference Among the Brazil biomass burning aircraft measurements, The air mass age : TRACE-A > BFA , SCAR-B The difference in airmass age estimated from observatinal data BFA : 0.5 days(13hrs), SCAR-B : 0.2 days (4.5 hrs) The emission ratios depend much on airmass age for reactive compounds (τ< 1 hour). It can vary more than an order. The emission ratios can keep original values for relatively long-lived compounds (τ > 1 hour).