
Abstract
Magnetic zenith. Diffuse proton aurora starting around 19 UT Spreads equatorward Seen over the whole field of view for few hours Not an artefact: transition not seen in other spectral ranges. Along the slit. Along the slit. Along the slit. Along the slit. Image. OI (777.4 nm).

Abstract
E N D
Presentation Transcript
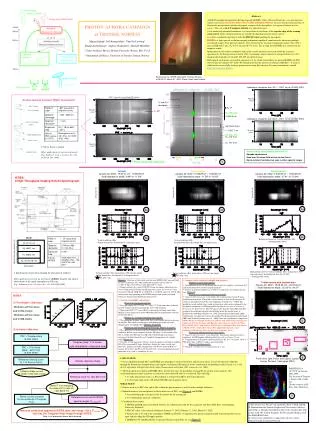
Magnetic zenith Diffuse proton aurora starting around 19 UT Spreads equatorward Seen over the whole field of view for few hours Not an artefact: transition not seen in other spectral ranges Along the slit Along the slit Along the slit Along the slit Image OI (777.4 nm) Hb (486.1 nm) Spatial information along the slit Ha (656.3 nm) N2+ 1N (427.8 nm) Wavelengths Hb Ne I Ha Xe I Ne I Ne I PAC + Tungsten lamp (& dark taken) Magnetic zenith Magnetic zenith Magnetic zenith Magnetic zenith PAC + C14 source [peak ~ 620.0 nm] (& dark taken) • Abstract • A High Throughput Imaging Echelle Spectrograph (HiTIES), built at Boston University, was operating last winter season from November 2001 to March 2002 at Tromsø, Norway, for assessing the characteristics of the particle precipitations and the subsequent response of the ionosphere, in a region of intense proton aurora. This site at 66.4ºN magnetic latitude was chosen because: • for moderately disturbed conditions, it is located for several hours at the equator edge of the evening auroral oval, where energetic protons are usually the dominant particle energy source, • it offers combined experiments with the EISCAT radar probing the ionosphere. • HiTIES is a high spectral resolution imaging instrument capable of simultaneously observing multiple wavelength ranges. Four spectral windows were selected in the location of important features: Ha (656.3 nm) and Hb (486.1 nm), N2+ 427.8 nm and OI 777.4 nm. The 8º long slit of HiTIES was centered on the magnetic zenith. • Information on the weather conditions and on the overall auroral activity is provided by a second spectrometer, the Proton Aurora Context (PAC) instrument, which consists of a large field of view (60º) imaging spectrograph covering the 400-800 nm spectral range. • Both optical instruments successfully operated over the whole winter. Here we present HiTIES and PAC observations for January 20th, 2002. We demonstrate that the spectral resolution of HiTIES (~ 0.1 nm) is sufficient for successfully studying proton aurora using Ha emission. For more information, consult: http://www.bu.edu/csp/hities PROTON AURORA CAMPAIGN at TROMSØ, NORWAY Marina Galand1, Jeff Baumgardner1, Unni Pia Lovhaug2, Duggirala Pallamraju1 , Supriya Chakrabarti1 , Michael Mendillo1 1 Center for Space Physics, Boston University, Boston, MA, U.S.A. 2 Department of Physics, University of Tromsø, Tromsø, Norway. Aurora over the HiTIES instrument, Tromsø, Norway, at 20:30 UT, March 4th, 2002. Photo Credit: Jouni Jussila. Jeffowgram: integration over 431.7 – 539.1 nm for 20/2002 (PAC) PAC: auroral e- arc & faint H+ aurora Proton Aurora Context (PAC) instrument O2 and H2O absorption N2 1P e- arc Ha 656.3 nm OI 630.0 nm Jeffowgram: integration over 654.5 – 657.1 nm for 20/2002 (PAC) Hg (Street lines) OI 557.7 nm Hb 486.1 nm N2+ 470.9 nm N2+ 427.8 nm • Grism: Prism + grating • Other applicationsof such an instrument: • [e.g., Semeter, J. et al., J. Geophys. Res., 104, 24,565-24, 585, 1999]. 1 Proton aurora (Ha: 656.3 nm) Twilight January 20, 2002 / 15:00:01 UT - 15:28:29 UT Solar depression angle: -9.48º to -11.59º Later twilight January 20, 2002 / 15:28:29 UT – 16:25:25 UT Solar depression angle: -11.59º to -16.23º Proton aurora January 20, 2002 / 18:35:32 UT – 19:32:28 UT Solar depression angle: -27.41º to -31.94º HiTIES: A High Throughput Imaging Echelle Spectrograph 4a 2a 3a 4b 2b 3b Background removed; Vertical solid line (Hb) + H lamp profile shown Vertical solid line (Hb), dashed-dotted lines (Fraunhofer Fe I absorption lines) Vertical solid line (Hb), dashed-dotted lines (Fraunhofer Fe I absorption lines) 4c 2c 3c Background removed; Vertical solid line (Ha), dashed lines (OH emission bands), dashed-dotted lines (N2 1P, NII) + H lamp profile shown • Simultaneous observations through the four spectral windows • Other applications of such an instrument:HiRISE: dayglow and auroral observations of the sunlit atmosphere in 630.0 nm • [e.g., Pallamraju et al., J. Geophys. Res., 106, 5543-5550, 2001]. Vertical solid line (Ha), dashed lines (OH emission bands), dashed-dotted lines (Fraunhofer Fe I absorption lines) NII (658.3 nm) Vertical solid line (Ha), dashed lines (OH emission bands) NII (658.3 nm) • Aurora (with scattered sunlight and airglow): • Figures 4a and 5 (top panels): • Intensification of the OI line during auroral activity (airglow + excitation of O and dissociation of O2 by the energetic particles) • Intense auroral lines/bands (e.g., N2 1P (8,7) and (2,0)) seen during electron arcs (Figure 5) • Figures 4a (second panel from top) and 4b: • Doppler-shifted magnetic zenith Hb profile resulting from excited H atoms inside the proton beam. The profile is blue-shifted, as most of the energetic H atoms are going downward. The total brightness is found to be ~150 R. The profile has a red-shifted wing, which is larger than what can be explained by the instrument resolution (see H lamp profile attesting of a spectral resolution of 0.06 nm in the Hb window). This red wing results from the upward H atom flux produced by collisional angular redistribution inside the proton beam, as predicted by modeling [Galand et al., 1998; Lummerzheim and Galand, 2001]; confirmation of earlier observations from Poker Flat [Lummerzheim and Galand, 2001] and Svalbard [Lanchester et al., 2002]. Note that a preliminary comparison shows that the wavelength of the peak and the half width of the red wing are similar in all three locations and that the violet wings are similar in Poker Flat (MLAT=65.2º) and Tromsø (MLAT=66.4º) and larger than in Svalbard (MLAT=75.0º), which observed a softer population (dayside, cusp) compared with the two other stations (center plasma sheet). • Figures 4a (third panel from top) and 4c: • Doppler-shifted magnetic zenith Ha profile from proton aurora [see above, comments for Hb Doppler-shifted profile]. Spectral resolution: 0.1 nm. • Contamination of the proton aurora H profile by N2 1P (7,4) and N2 1P (6,3) + NII (658.3 nm) + OH(6,1) bands + geocoronal Ha. • Figure 5 (bottom panel): • Strong N2+ 1N (0,1) 427.81 nm emission in e- arcs. • Figure 1: Overview of the visible activity over HiTIES (PAC centered field of view) on January 20th, 2002 [moderate magnetic activity: Kp (15-18 UT)=3; Kp (18-24 UT)=2; solar index f10.7 = 222] • Strong sunlight effect until 15:00 UT. Green star shows when the proton aurora (characterized by Ha and Hb emissions) starts. Electron arcs seen between 19:30 and 20:00 UT, at 21:00 UT, at 21:30 UT, and at 22:45 UT. The time periods corresponding to the HiTIES images and spectra presented below are shown with colored horizontal arrows. • Scattered sunlight and airglow: • Figures 2a (top panel) and 3a: • Far right, triplet OI (777.2 nm, 777.4 nm, 777.5 nm) emissions produced in the F-region from the recombination of O+ with electrons • Shortward of OI 777.2 nm, OH(9,4) vibrational-rotational bands from Meinel system originated at about 80-90 km from the displacement reaction between H and O3 . • Figures 2a (second panel from top) and 2b: • The absorption features (shown: Hb, Fe I) result from Rayleigh scattering of sunlight. The signal level decreases with depression angle up to the disappearance of sunlight effect (Figures 3a and 3b). • Figures 2a and 3a (third panel from top), Figures 2c and 3c: • The signal level associated with the Fraunhofer absorption features is smaller in the Ha range compared with the Hb range, as the incident solar flux is smaller near Ha than near Hb and as the Rayleigh scattering is stronger in the blue than in the red. Complete disappearance of sunlight effect (Figure 3c). • Presence of emission peaks: Ha line (from resonance scattering of sunlight H Lyb by geocoronal H atoms [both lines sharing the same excited state H(n=3)] + galactic and stellar background); OH Meinel bands [OH(6,1) P branch: P1(2)-P1(5) and P2(2)-P2(5)]; NII (658.3 nm) from photodissociative ionization of N2 with e- quenching, N+ loss. Proton aurora with electron arcs January 20, 2002 / 19:36:32 UT – 20:05:00 UT Solar depression angle: -32.23º to -34.27º • HiTIES: • Wavelength Calibration: • - Hydrogen and Neon lamps • used for Ha window, • - Hydrogen and Xeon lamps • used for Hb window • (2) Intensity calibration 5 Tungsten_lamp / C14 source (with normalization of exposure time) 6 • CONCLUSION: • Great capability through PAC and HiTIES spectrographs to analyze the proton and electron aurora. Successful spectral validation through the Fraunhofer absorption lines and airglow. Preliminary Hb analysis shows confirmation of modeling results [Galand et al., 1998] & is in agreement with previous observations [Lummerzheim and Galand, 2001; Lanchester et al., 2002]. • The high spectral resolution of HiTIES offers, for the first time, the possibility of using Ha for proton aurora analysis. The contamination from other emissions or sources has been detected and can be removed. This will help: • to study faint proton aurora, as Ha response is stronger than Hb to proton precipitation. • to shed some light on the still debated Ha/Hb ratio in proton aurora. • WHAT NEXT? • Further analysis of PAC data and of Ha (within the proton aurora as well as under sunlight influence) • Indentification of stars and planets in the field of view of PAC (see Figure 6) and HiTIES: • for establishing the exact part of the sky probed by the instruments • for validating the intensity calibration • Combined observations: • HiTIES and ESR radar at Svalbard, Norway (in collaboration with Dr. B. Lanchester and Prof. M.H. Rees, Southampton University, England) • EISCAT radar: 3 days already identified (January 7th, 2002; February 1st, 2002; March 4th, 2002) • Particle data at the top of the atmosphere (DMSP and FAST) + Comprehensive proton transport model using the particle data as input and providing the H Doppler profiles. • TIMED/GUVI and IMAGE/SI12 (spectral filtering around H Ly a) (see Figure 7) From left to right: Pollux and Castor, Jupiter, Auriga, Perseus, Cassiopiea (PAC). Intensity reference image Reference intensity curve for C14 Source (R/nm) IMAGE/SI12 at 18:57 UT on January 20th, 2002. The location of Tromsø is shown with a white star. [To the courtesy of H. Frey, Univ. Berkeley] Collapse image around the center of the field of view Reference curve f(l) near 620.0 nm Derive T from matching the slope of P(l) with f(l) near 620.0 nm 7 Planck curves corrected for the emissivity of Tungsten PT(l) Reference curve over all HiTIES spectral ranges, PT=3100K (l) Acknowledgments: We are very grateful to Prof. C. Hall and Mr. B. Hansen from the Tromsø Geophysical Observatory, Norway, and to Ms. A. Berquist from Boston University, for their key help in this work. We warmly thank Dr. H. Frey for providing us with the IMAGE/SI12 data. If you have any comments or suggestions, please contact: Marina Galand at mgaland@bu.edu Intensity calibration applied to HiTIES data: sky image / flat x PT=3100K (l) with flat, the Tungsten lamp image through HiTIES Note: In all processes above, dark removed


