Download
1 / 2
20 likes | 192 Views
Snail Kite. Radio-telemetry Tracking Tools. Wading Birds. Individual-Based Models. Florida Panther. ATLSS and the Planning Process for Everglades Restoration . Age/Size Structured Models. Alligators. Fish Functional Groups. Reptiles and Amphibians.

E N D
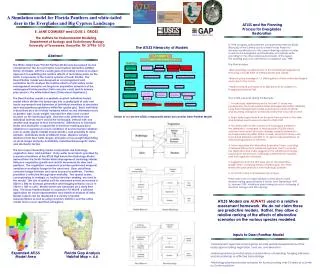
Snail Kite Radio-telemetry Tracking Tools Wading Birds Individual-Based Models Florida Panther ATLSS and the Planning Process for Everglades Restoration Age/Size Structured Models Alligators Fish Functional Groups Reptiles and Amphibians Inputs to Deer/Panther Model Abstract Abiotic Conditions Models Linked Cell Models Lower Trophic Level Components Vegetation Process Models • In 1992 Congress authorized the Comprehensive Review Study • (Restudy) of the Central and Southern Florida Project to • develop modifications to the current drainage system in order • to restore the Everglades and Florida Bay ecosystems while • providing for the other water-related needs of the region. • The resulting plan was submitted to Congress in July, 1999. • The Plan includes: • Reconnecting over 80 percent of the remaining Everglades by removing over 240 miles of internal levees and canals. • Reducing the average of 1.7 billion gallons of fresh water discharged every day to the ocean • Additional land purchases of 47,000 acres as an addition to Everglades National Park • How ATLSS was used during the Restudy: • 1. A hydrologic alternative plan for the next 31 years was • produced by the South Florida Water Management District (SFWMD) • using their management model, based upon historical rainfall • and assuming changes in control structures that occur all at once. • 2. Major hydrologic results from the plan were posted on the Web • and detailed results were provided to ATLSS staff. • 3. The ATLSS staff ran the collection of ecological models for • the alternative, compared to the base plan (F2050) which • assumed only control structure changes currently planned to • be implemented by 2050. Within a week, results from these were • bound and shipped overnight to 14 agency representatives, as • well as being placed on the Web. • 4. A few days later the Alternative Evaluation Team, consisting • of representatives from interested agencies, met to evaluate • the alternative and make suggestions for additional changes, • based upon ATLSS results, hydrologic performance measures, • and their agencies mandate. • 5. Suggestions from the AET were sent to the Alternative • Design Team, consisting mostly of hydrologists, who then • revised the plan and ran a new hydrologic scenario. • 6. Go back to step 2 and repeat many times. • There were over 15 major iterations of the above, each • iteration taking approximately 3 weeks, from September 1997 • to January 1999. Additional plans taking account of phasing of • structure changes are still ongoing. Cape Sable Seaside Sparrow Cape Sable Seaside Sparrow Spatially-Explicit Species Index Models White-tailed Deer White-tailed Deer Long-legged Wading Birds Short-legged Wading Birds Snail Kite Alligators High Resolution Hydrology Disturbance High Resolution Topography • Government agencies and programs provide spatial representations of the landscape including vegetation, land use, and elevation • Field researchers provide historical observations of breeding, foraging behavior, and abundances as affected by hydrology • Hydrology planners provide scenarios for future ponding over 31 years at a 2-mile by 2-mile resolution ATLSS Models are ALWAYS used in a relative assessment framework. We do not claim these are predictive models. Rather, they allow a relative ranking of the effects of alternative scenarios on the various species modeled. A Simulation model for Florida Panthers and white-tailed deer in the Everglades and Big Cypress Landscape E. JANE COMISKEY and LOUIS J. GROSS The Institute for Environmental Modeling, Department of Ecology and Evolutionary Biology University of Tennessee, Knoxville, TN 37996-1610 The ATLSS Hierarchy of Models ATLSS STRUCTURE Across Trophic Level System Simulation The White-tailed Deer/Florida Panther Model was developed as one component of the Across Trophic Level System Simulation (ATLSS) family of models, with the overall goal of providing a total ecosystem approach to predicting the relative effects of restoration plans on the biotic components of the natural systems of South Florida. The Deer/Panther model was designed as a management and evaluation tool to analyze the relative effects of alternative water management scenarios on long-term population dynamics of the endangered Florida panther (Felis concolor coryi) and its primary prey species, the white-tailed deer (Odocoileus virginianus.) The Deer/Panther model is a spatially-explicit, individual-based model which divides the landscape into a spatial grid of cells and tracks movements and behaviors of individual members of simulated deer and panther populations within this spatial grid. Each individual is described by a set of state variables which record information such as gender, age, body weight, reproductive status and current location on the landscape grid. Decision rules determine how individual animals move across the landscape, interact with one another and respond to their environment. Differences in individual states and stochastic components in decision-making produce variations in responses to local conditions of environmental variables such as water depth, habitat characteristics, and proximity to other animals. Individuals mate at different times, disperse varying distances from their natal ranges, and gain or lose weight depending on local forage and prey availability, individual bioenergetic status, and stochastic factors The four major interacting model components are hydrology, vegetation, deer, and panthers. Daily water level inputs, provided by scenario simulations of the ATLSS High Resolution Hydrology Model derived from the South Florida Water Management Hydrology Model, influence vegetation growth and restrict movement for deer and panthers. The vegetation component provides spatial and temporal variation in available forage for the deer herd. Deer selectively consume forage biomass and serve as prey for panthers. Panther predation is reflected through deer mortality. Two spatial scales, corresponding to strategic vs. tactical decision-making, are used in the model. The size of spatial cells for simulated animal movement is 500-m x 500-m; biomass generation and foraging behavior occur in 100-m x 100-m cells. Model events are simulated on a daily time step. The Deer/Panther Model is coupled to PV-WAVE, a software application for visual representation and statistical analysis of data. Model outputs can be displayed in a variety of spatial representations as well as using summary statistics over the entire model area or over specified subregions. Model Type © TIEM / University of Tennessee 1999 Shown in red are the ATLSS components which are used for Deer-Panther Model Expanded ATLSS Model Area Florida Gap Analysis Habitat Map v. 6.6
Some References on ATLSS ATLSS Home Page http://atlss.org/ Comiskey, E.J., L.J. Gross, D.M. Fleming, M.A. Huston, O.L. Bass, H.K. Luh, and Y. Wu. 1994. A Spatially-explicit Individual-based Simulation Model for Florida Panther and White-tailed Deer in the Everglades and Big Cypress Landscapes. In D. Jordan, ed. Panther Conference Proceedings, Ft. Myers, Florida, U.S. Fish and Wildlife Service. Curnutt, J. L., E. J. Comiskey, M. P. Nott and L. J. Gross. 2000. Landscape-based spatially-explicit species index models for Everglades restoration. Ecological Applications 10: 1849-1860. DeAngelis, D. L., L. J. Gross, M. A. Huston, W. F. Wolff, D. M. Fleming, E. J. Comiskey, S. M. Sylvester. 1998. Landscape Modeling for Everglades Ecosystem Restoration. Ecosystems 1:64-75. DeAngelis, D. L., L. J. Gross, W. F. Wolff, D. M. Fleming, M. P. Nott and E. J. Comiskey. 2000. Individual-based models on the landscape: applications to the Everglades. P. 199-211 in J. Sanderson and L. D. Harris (eds.), Landscape Ecology: A Top-Down Approach. Lewis Publishers, Boca Raton, FL. Duke-Sylvester, S. and L. J. Gross. 2000. Integrating spatial data into an agent-based modeling system: ideas and lessons from the development of the Across Trophic Level System Simulation (ATLSS). To appear in: Agent-based models and GIS, R. Gimblett (ed.), Oxford University Press. Gaff, H., D. L. DeAngelis, L. J. Gross, R. Salinas and M. Shorrosh. 2000. A dynamic landscape model for fish in the Everglades and its application to restoration. Ecological Modelling 127:33-52. Work in Progress Using empirical panther data to define panther behavior rules: habitat use and habitat/homerange associations • Deer/Panther model development efforts, deferred while the extensive Restudy scenario evaluations were being produced during 1998 and 1999, are ongoing to expand the model area and enhance the realism of the model. • The Deer/Panther model was designed to be used as a management and evaluation tool to analyze the relative effects of alternative water management scenarios on long-term population dynamics of the Florida panthers and their primary prey species, white-tailed deer. Originally conceived as one component of a group of interconnected ATLSS models and driven by an improved and expanded SFWMD Hydrology Model, the model's projected functionality is somewhat compromised by the necessary modifications of original plans which resulted in an indefinite delay in provision of expanded hydrology inputs from the District and postponement of development of a vegetation succession model. • The following efforts have been undertaken to make Deer/Panther simulations more realistic and computationally efficient: • Analyses of radio telemetry data and review of published literature about panthers in South Florida led to the realization that population dynamics could not be realistically modeled within the the original ATLSS model area, restricted by availability of hydrologic inputs from the SFWMD Hydrology Model. An expanded model area is being provided by methods described elsewhere in this document. • A stable version of the FGAP vegetation map (Version 6.6) has recently become available, and the extensive work required to adapt this new and substantially modified version for use in Deer/Panther is near completion. The vegetation component of Deer/Panther, which provides spatial and temporal variation in available forage for the deer herd, is being modified to provide realistic levels of Type I, II, and III forage based on the FGAP Version 6.6 vegetation types, and deer and panther behaviors which are influenced by habitat type are likewise being modified to account for the habitat map change. • The most recent version of the evolving ATLSS landscape classes has been incorporated into Deer/Panther, dramatically reducing the run-time required for simulations. Final timings and comparisons to observational data have been deferred until incorporation of the new habitat map has been completed. • The predictive capabilities of an individual-based model is closely tied to the realism of the decision rules which determine how individual animals move across the landscape, interact with one another and respond to their environment. The definition of these rules is in turn tied to the availability and interpretation of empirical observations about these behaviors and movement patterns. Recent developments in panther recovery have contradicted and confounded published theories and opinions about panther ecology in South Florida, including ideas about habitat use, home range establishment, female fecundity, kitten survival, and dispersal patterns. For example, panther literature has reflected the commonly held perception that Big Cypress south of I-75 could not sustain a breeding population of panthers because of thinning forest cover and poor soils. However, the largest population expansion over the past two years has taken place in this area. With this in mind, the telemetry data set of panther location observations (1981-1995) on which preliminary panther behavior rules for the Deer/Panther model were based has been expanded to include observations through December 1999 so that recent trends can be reflected in revised behavior rules. Observations from January-July 2000 will be incorporated when data are made available. • Work will begin soon on an ATLSS model of vegetation succession in South Florida, which will enhance the predictive capabilities of Deer/Panther as well as many of the other ATLSS models. Recent panther locations Panther telemetry: 1999 Panther locations over forested habitat Habitat edge metric ATLSS Panther Modeling Dr. Louis J. Gross Jane Comiskey Scott M. Duke-Sylvester The Institute for Environmental Modeling University of Tennessee Dr. Donald DeAngelis University of Miami Oron L. Bass South Florida Natural Resources Center Everglades National Park ATLSS Collaborators and Data Providers Big Cypress National Preserve: Deborah Jansen, Wildlife Biologist, National Park Service Florida Fish and Wildlife Conservation Commission: Darrell Land, Florida Panther Recovery Project Leader Roy McBride, Florida Panther Capture Team The Deer/Panther modeling effort ongoing at the University of Tennessee has been supported by the U. S. Geological Survey, Biological Resources Division, through Cooperative Agreement #1445-CA09-95-0094.


