V.2 Wavepath Migration
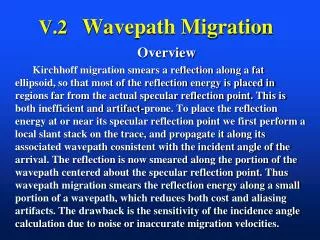
V.2 Wavepath Migration. Overview

V.2 Wavepath Migration
E N D
Presentation Transcript
V.2 Wavepath Migration Overview Kirchhoff migration smears a reflection along a fat ellipsoid, so that most of the reflection energy is placed in regions far from the actual specular reflection point. This is both inefficient and artifact-prone. To place the reflection energy at or near its specular reflection point we first perform a local slant stack on the trace, and propagate it along its associated wavepath cosnistent with the incident angle of the arrival. The reflection is now smeared along the portion of the wavepath centered about the specular reflection point. Thus wavepath migration smears the reflection energy along a small portion of a wavepath, which reduces both cost and aliasing artifacts. The drawback is the sensitivity of the incidence angle calculation due to noise or inaccurate migration velocities.
Outline Problem & Motivation Theory Synthetic Numerical Examples Field Data Numerical Examples Conclusions
Target RTM Phase-Shift No Approx. Ray-Beam Kirchhoff Migration Accuracy vs $$$ Full-Wave Accuracy Multiple Arriv Anti-aliasing Expense
Problem A B C C B A R S 3-D KM of a Single Trace
Problem & Solution Problem: Kirchhoff Migration Expensive; O(N ) per Trace Reflection Energy Smeared All Along Ellipse Solution: Wavepath Migration. Smear Energy along Wavepaths not Ellipses; O(N )per Trace 3 1.5
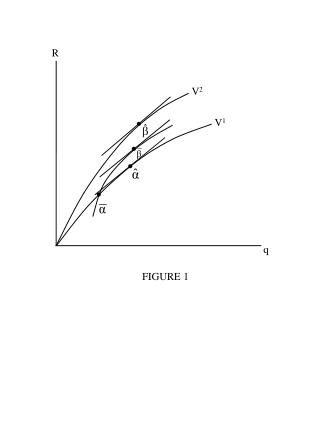
Fresnel Zone Smear Reflection along Wavepath Inc. Angle by Slant Stack S R Image Point
MVA Objectives • Can WMVA effectively improve the • migration velocity? • Whether the WMVA updated velocity • differs much from the KMVA updated • velocity? • Can WMVA be much faster than • KMVA?
A B C Solution C B A R S 3-D WM of a Single Trace
Problem & Solution Problem: Kirchhoff Migration Expensive; O(N ) per Trace Reflection Energy Smeared All Along Ellipse Solution: Wavepath Migration. Smear Energy along Wavepaths not Ellipses; O(N )per Trace 3 1.5
Numerical Tests • 3-D Pt. Scatterer Model
3-D Prestack KM Point Scatterer Response 0.1 0.4 Reflectivity Reflectivity Z0-9 Z0-1 -0.05 -0.2 1 1 1 1 Y Offset (km) Y Offset (km) X Offset (km) X Offset (km) 0 0 1 0.02 Reflectivity Reflectivity Z0 Z0+8 -0.5 -0.01 1 1 1 1 Y Offset (km) Y Offset (km) X Offset (km) X Offset (km) 0 0
3-D Prestack WM Point Scatterer Response 0.1 0.4 Reflectivity Reflectivity Z0-9 Z0-1 -0.05 -0.2 1 1 1 1 Y Offset (km) Y Offset (km) X Offset (km) X Offset (km) 0 0 1 0.02 Reflectivity Reflectivity Z0 Z0+8 -0.5 -0.01 1 1 1 1 Y Offset (km) Y Offset (km) X Offset (km) X Offset (km) 0 0
2-D SEG/EAGE overthrust model Numerical Tests • 3-D Pt. Scatterer Model
0km 5km 10km 15km 0 6000 1500 Velocity (m/sec) Depth (m) 3000 2500 4500 Velocity Model
Wavepath vs Kirchhoff Migration WM Image (CPU: 0.088) KM Image (CPU: 1.0) Structure (Slant Stack) 4 Offset (km) 10 4 Offset (km) 10 4 Offset (km) 10 0.5 Depth (km) 2.5
2-D Canadian Land Data Numerical Tests • 3-D Pt. Scatterer Model • 2-D SEG/EAGE overthrust model
A Raw CSG of Husky Field Data Trace Number 1 300 0 Time (sec) 3.0
Husky Field Data Results KM (CPU:1.0) WM (CPU: 2.23) 0 Offset (km) 14 Offset (km) 14 0 0 A A Depth (km) B B 7
KM Image (Box A) WM Image (Box A) Husky Field Data Results 2.5 Offset (km) 5.5 2.5 Offset (km) 5.5 2.5 2.5 Depth (km) Depth (km) 5.0 5.0
Husky Field Data Results KM (CPU:1.0) WM (Slant Stack, CPU: 0.24) 0 Offset (km) 14 0 Offset (km) 14 0 A A Depth (km) B B 7
3-D SEG/EAGE Salt Model Numerical Tests • 3-D Pt. Scatterer Model • 2-D SEG/EAGE overthrust model • 2-D Canadian Land Data
Receiver Distribution 1920 Crossline (m) 2320 1920 4480 Inline (m)
SALT Inline Velocity Model Offset (km) 0 9.2 0 Depth (km) 3.8
Inline KM(CPU=1) Inline WM(CPU=1/33) Offset (km) Offset (km) 0 9.2 0 9.2 0 Depth (km) 3.8
Zoom Views of Inline Sections Kirchhoff WM Sub WM Model Offset: 3~6.5 km, Depth: 0.3~1.8 km
KM WM Sub WM Offset: 1.8~4 km, Depth: 0.6~2.1 km Migration of SEG Salt Data (Crossline Sections) Model
Migration of SEG Salt Data (Horizontal Slices) KM WM Sub WM Model Inline: 1.8~7.2 km, Crossline: 0~4 km
3-D W. Texas Data Numerical Tests • 3-D Pt. Scatterer Model • 2-D SEG/EAGE Overthrust model • 2-D Canadian Land Data • 3-D SEG/EAGE Salt Model
A Common Shot Gather 54 Trace Number 193 0 Time (sec) 3.4
3.5 Crossline (km) 1.2 1.5 Inline (km) 4.5 Receiver Distribution
Receiver Distribution 3.5 Crossline (km) 1.2 1.5 Inline (km) 4.5
Inline KM (CPU=1) Inline WM(CPU=1/14) Offset (km) Offset (km) 0.4 4.5 0.4 4.5 0.8 Depth (km) 3.8
Inline KM(CPU=1) Inline WM(CPU=1/50) (subsample) Offset (km) Offset (km) 0.4 4.5 0.4 4.5 0.8 Depth (km) 3.8
Crossline KM (CPU=1) Crossline WM(CPU=1/14) Offset (km) Offset (km) 0.3 3.5 0.3 3.5 0.8 Depth (km) 3.3
Crossline KM(CPU=1) Crossline WM(CPU=1/50) (subsample) Offset (km) Offset (km) 0.3 3.5 0.3 3.5 0.8 Depth (km) 3.3
Horizontal Slices (Depth=2.5 km) WM (Sub, CPU=1/50) KM (CPU=1) WM (CPU=1/14) Inline: 0~4.6 km, Crossline: 0~3.8
MVA Numerical Tests • 3-D Pt. Scatterer Model • 2-D SEG/EAGE Overthrust model • 2-D Canadian Land Data • 3-D SEG/EAGE Salt Model • 3-D W. Texas Data
Initial Migration Velocity Horizontal Distance (km) 0 18 0 2.1 Depth (km) (km /s) 1.5 1.5
KM Image with Initial Velocity 0 18 km 0 Depth (km) 1.5 KMVA Velocity Changes in the 1st Iteration 0 50 Depth (km) (m /s) 0 1.5
KM Image with Initial Velocity 2 km 9 km 1070 Depth (m) 1260 KM Image with Updated Velocity 1070 Depth (m) 1260
KMVA CIGs with Initial Velocity KMVA CIGs with Updated Velocity 0 Depth (km) 1.5
KMVA Velocity Changes in the 1st Iteration (CPU=6) 0 18 km 0 50 Depth (km) (m /s) 0 1.5 WMVA Velocity Changes in the 1st Iteration (CPU=1) 0 50 Depth (km) (m /s) 0 1.5
WM Image with Initial Velocity 2 km 9 km 1070 Depth (m) 1260 WM Image with Updated Velocity 1070 Depth (m) 1260
WMVA CIGs with Initial Velocity WMVA CIGs with Updated Velocity 0 Depth (km) 1.5
KM Image with Initial Velocity 2 km 9 km 1070 Depth (m) 1260 KM Image with KMVA Updated Velocity 1070 Depth (m) 1260 KM Image with WMVA Updated Velocity 1070 Depth (m) 1260
Crosswell Data Numerical Tests • 3-D Pt. Scatterer Model • 2-D SEG/EAGE Overthrust model • 2-D Canadian Land Data • 3-D SEG/EAGE Salt Model
Crosswell Imaging of Synthetic Fault Data Model KM WM 0 210 Depth (m) 0 90
Conclusions • Typically WM has fewer artifacts than KM • Typically WM 2-50 times faster than than KM • Tradeoff between quality and speed • Conflicting dip arrivals still an issue • Slant stack traces essential for efficiency • Fast velocity analysis tool
Works on synthetic and field poststack time migration data, improve resolution, mitigate some migration artifacts Subdivision method is able to account for lateral-velocity variations and attenuate some far-field artifacts A post-migration processing: Cost 2X Conclusions
Target RTM Phase-Shift No Approx. Ray-Beam Kirchhoff Migration Accuracy vs $$$ Full-Wave Accuracy Multiple Arriv Anti-aliasing Expense