
Abstract
Stream Bed Morphology and Discharge Rates of Deckers Creek. April Polycandriotis , Nicole Vallencourt, and Winnie Mungai from Kennesaw State University Department of Geography and Anthropology Smriti Chand from Indiana State University Department of Geography, Geology, & Anthropology.

Abstract
E N D
Presentation Transcript
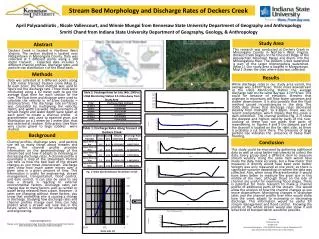
Stream Bed Morphology and Discharge Rates of Deckers Creek April Polycandriotis , Nicole Vallencourt, and Winnie Mungai from Kennesaw State University Department of Geography and Anthropology Smriti Chand from Indiana State University Department of Geography, Geology, & Anthropology Study Area Abstract This research was conducted at Deckers Creek in Monongalia County in Northern West Virginia. Deckers Creek begins on the Chesnutt Ridge of the Appalachian Mountain Range and drains into the Monongahela River. The Deckers Creek watershed is part of the larger Monongahela watershed. (Map 1). Our study area is located in Morgantown. Map 2 shows the sites where data was collected. Deckers Creek is located in Northern West Virginia. The section studied is located near Morgantown in Monangalia County. Data was collected at 5 different points along a 100 meter transect . Collected data includes 5 different channel profiles, discharge rates ,and particle size distribution s of the flood bank. Methods Results Data was collected at 5 different points along a 100 meter transect Deckers creek (Map 2). At each point, the float method was used to figure out the discharge rate. Three trials were conducted along a 10 meter path to get the average float time for each section of the river. The float time and distance were used to calculate the velocity in m^2/sec (velocity = distance/time). The discharge rate (m^3/sec) was calculated by multiplying the velocity, depth, and width (Q=wdv). Measurements of terrace height and water depth were taken at each point to create a channel profile. A gravelometer was used to examine grain size distribution on a 1 meter by 1 meter plot that was selected at random. Only grains sizes from very course gravel to large cobbles were studied. While discharge rates in our study area varied, the average was 3.87m^3/sec. Three miles downstream at the USGS Monitoring Station the average discharge rate on the same day was .17m^3/sec. This could be because of elevation. Streams that originate in mountains will flow faster upstream and slower downstream. It is also possible that the float method caused inconsistencies in the data. The USGS data shows that discharge rates decreased steadily from midnight to 3:30pm. There was no recent precipitation, which implies that this creek is dam controlled. The channel profiles (fig. 2-7) show the deepest and highest velocity parts of the river. Looking at these you can guess that parts of meandering. In figures 4 and 5 the deepest part of the channel is located on the far right side, so there is probably a cut bank there. The presence of large particle size indicates the presence of heavy flash flooding. Background Conclusion Channel profiles, discharge rates , and particle size tell us many things about streams and rivers. The channel profile provides information on the geomorphology of the stream bed and how it adapts to increasing or decreasing discharge rates. A channel profile is essentially a map of the streambed. Particle size tells us how the bed load of the stream changes as you move downstream. Discharge rates show how much water moves over a given area in a given amount of time. This information is useful for engineering, stream management, transportation, flood control, and dam control. It can also be used to see how a stream is reacting to external environmental factors. Discharge rates can change due to many factors such as rainfall or water being released from a dam. However , it rates are changing without these factors, you know that something else is causing a change in discharge. Studying how discharge rates and channel profiles change over time can help predict what a stream will look like in the future, which is important for urban planning and engineering. This study could be improved by gathering additional data as well as using better instruments to collect the data. Every group used a different item to measure stream velocity. Using the same item would have made the data more accurate, but a flow meter that measures it directly would have been even better. Velocity was only measured at one point, so there is significant variance depending on where the data was collected. Also, when using the gravelometer it would have been better to measure the grain size in this middle of the river, although those on the side of channel are useful for examining flood stages. There is potential for more research to make a channel profile of additional parts of the stream. This would allow the analysis of how the channel changes as you move downstream. Monitoring changes in discharge rates and the channel profile over time would show how the creek adapts to increasing or decreasing discharge. This information would be useful for stream management and flood control. Knowing the profile of the whole stream would also show if and what kind of transportation would be possible. Acknowledgements Thanks to Dr. Nancy Hoalst-Pullen from KSU and Dr. Jay Gatrell from ISU for their instruction and assistance with this project. Sources Deckerscreek.org Google Earth nwis.waterdata.usgs.gov - USGS 03062500 Deckers Creek at Morgantown, WV Data collected during field method class in West Virginia


