Download
1 / 27
270 likes | 924 Views
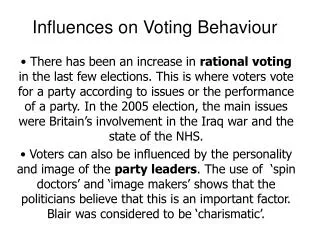
Voting Behaviour in the UK 1945-2005. Part C: Social Influences on Voting and Non-Voting. Voting Behaviour in the UK: Part C: Recent General Elections: Social Influences on Voting and Non-Voting. In Part C I provide the following information.

E N D
Voting Behaviour in the UK 1945-2005 Part C: Social Influences on Voting and Non-Voting
Voting Behaviour in the UK: Part C: Recent General Elections: Social Influences on Voting and Non-Voting • In Part C I provide the following information. • Click here for BBC Information on all post war General Elections • Summary results for the 1979-2005 General Elections. • Statistical trends on class, region , gender, age , religion and ethnicity and voting behaviour. • Some information on Non-Voting • This will be followed by Part D in which I provide more “political” information on the General Elections of 1992, 1997, 2001 and 2005.
Voting Behaviour in the UK: Part C: Index • Recent General Election Results • Voting Behaviour and Social Class • Region and Voting Behaviour • Gender and Voting Behaviour • Ethnicity, Religion and Voting Behaviour • Electoral Turnout
Seats Won 1979-2005 Con Lab “Lib” SNP/PC Other
Voting Behaviour and Social Class 1979-2005 • Click here for data from IPSOS MORI on relationships between social class and voting behaviour 1974- 2005. • However remember the problems of defining social class and the different approaches to the measurement of class dealignment. • The following three slides illustrate the changing relationships between social class and voting behaviour between 1992 and 2005 as measured by the AB, C1, C2 and DE social class schema.
Housing2005 Cons Lab L-D • Home owners with mortgage 30 39 23 • Home owners without mortgage 43 30 20 • Council tenants 16 56 19
Regional Voting Trends1997 -2005 [1] [Coloured figures =2001]
Gender and Voting Behaviour 1974-2005 • Click here for IPSOS MORI data on Gender and Voting Behaviour 1974- 2005 • Click here for IPSOS MORI data on gender, age and voting behaviour in the 2005 General Election • The following 4 slides have been copied directly from the first part of the voting behaviour presentation. You may already have seen these!
Gender and Voting Behaviour [1] • Relationships between gender and voting behaviour are summarised in trends in the so-called gender gap in voting behaviour • The gender gap is defined as the difference between the % Conservative- Labour lead among women and the % Conservative-Labour lead among men. • Calculated in this way a negative gender gap indicates that women were more pro-Conservative than men and a positive gender gap suggests that men are more pro-Conservative than women. • Gender gaps have indeed been negative for much of the post 2nd World War period but have declined in the 1990s and in 2005 there was a positive gender gap. • Click here and scroll down for gender gap calculations 1974-2005 from IPSOS MORI
Gender and Voting Behaviour [2] • The pro-Conservative/anti –Labour tendencies of female voters relative to male voters for much of the post-war period were explained by the following factors. • Women were less likely to be in employment than men and when they were in employment, less likely than men to be in heavily unionised occupations where Labour voting was most likely. • It was suggested that for much of the post –war period women could on average be described as having a more traditional outlook on life than men. Not a very convincing argument nowadays , you might think. • On average women live longer than men and older people are more pro-Conservative and anti- Labour than young people
Gender and Voting Behaviour [3] • The extent of relatively pro-Conservative/ anti-Labour voting behaviour among women always varied according to age and social class. • Also from the late 1980s this trend in female behaviour began to be reversed such that in 2005 women were relatively anti-Conservative/pro-Labour in comparison with men.
Gender and Voting Behaviour [4] • The data on the previous slide indicate that by 2005 younger women are particularly pro-Labour and anti-Conservative perhaps due to long run generational changes in attitudes and values and/or to the return to Parliament of an increasing number of female, Labour MPs and/or to Labour's greater willingness to campaign on female related issues. However many young women may have been dissuaded from voting Labour as a result of UK involvement in the Iraq war and , in any case no pro-Labour gender gap is present in the case of female voters 55+ • It will be interesting to see whether this new female support for the Labour Party holds up at the next General Election. What reasons are there for believing that it might not?
Voting Behaviour and non-Class Factors • PJG Pulzer stated that “Class is the basis of British party politics: all else is embellishment and detail.” We do however need to familiarise ourselves with such details: i.e. with the possible effects of region, ethnicity, age, gender and religion on voting behaviour. • Voters in Scotland, Wales and Northern England are more likely to vote Labour than voters in Southern England. • Ethnic minority voters are more likely to vote Labour than white voters. • Catholic voters were more likely to vote Labour than Protestant voters. • In each of these three cases this could be explained partly [but not entirely] by the indirect effects of social class in that the Scots, the Welsh, ethnic minority members and Catholics are also disproportionately likely to be working class [ which takes us back to the Pulzer quotation] • Click here and scroll down for further data and explanations re age, gender, region, religion, ethnicity and voting behaviour. • Note that many Muslim voters withdrew their support from Labour in the 2005 General Election as a result of the invasion of Iraq.
Variation in Election Turnout 2001 and 2005 : Affluence and Poverty • 2001 differential turnout by seat comparing poorer inner city with affluent southern seats: • Liverpool Riverside = 34%; Manchester Central = 39%; Hackney S & Shoreditch= 47%; Islington South = 47%; Bethnal Green & Bow = 49%. • Oxford W & Abingdon = 65%; Buckingham = 69%; Norwich S = 68%; North Norfolk = 70%; Wyre Forest = 68%. • In 2005 the highest English turnouts were in Dorset West [76.3%], Norfolk North [73.0%] Richmond Park [72.8%] and Mole Valley [72.5%]. • In 2005 the lowest English turnouts were in Staffordshire South [37.2%], Liverpool Riverside [41.5%], Manchester Central [42.0%] and Salford [42.4%]. • Click here for full information on constituency differences in turnout including maps of the UK and of the major UK conurbations. A very nice link , I think!
Interest in Politics: Note that declining turnout trends do not prove that interest in Politics is declining.
Electoral Turnout: Useful Sources • The analysis of electoral turnout raises a range of complex issues many of which are discussed in the following sources. • Click here and scroll down for very detailed analysis of the 2005 General Election by the authors of the 2005 British Election Study . Scroll to page 4 for analysis of electoral turnout. • Click here for the Power Report [which provides very detailed information on British Democracy ,electoral turnout and related issues ]. • Click here for full information on constituency differences in turnout including maps of the UK and of the major UK conurbations. [Already mentioned earlier.]
Campaigns and Tactical Voting • Campaigns and tactical voting are very important topics within the study of voting behaviour. • I hope to provide information on these topics at some point in the future.