Download
1 / 24
240 likes | 341 Views
Explore PepsiCo, a leading multinational food and beverage corporation with iconic brands like Pepsi, Lays, Gatorade, and Quaker. Learn about its international divisions, market shares, top brands, and societal influences. Delve into its strengths, weaknesses, and the competitive market landscape.

E N D
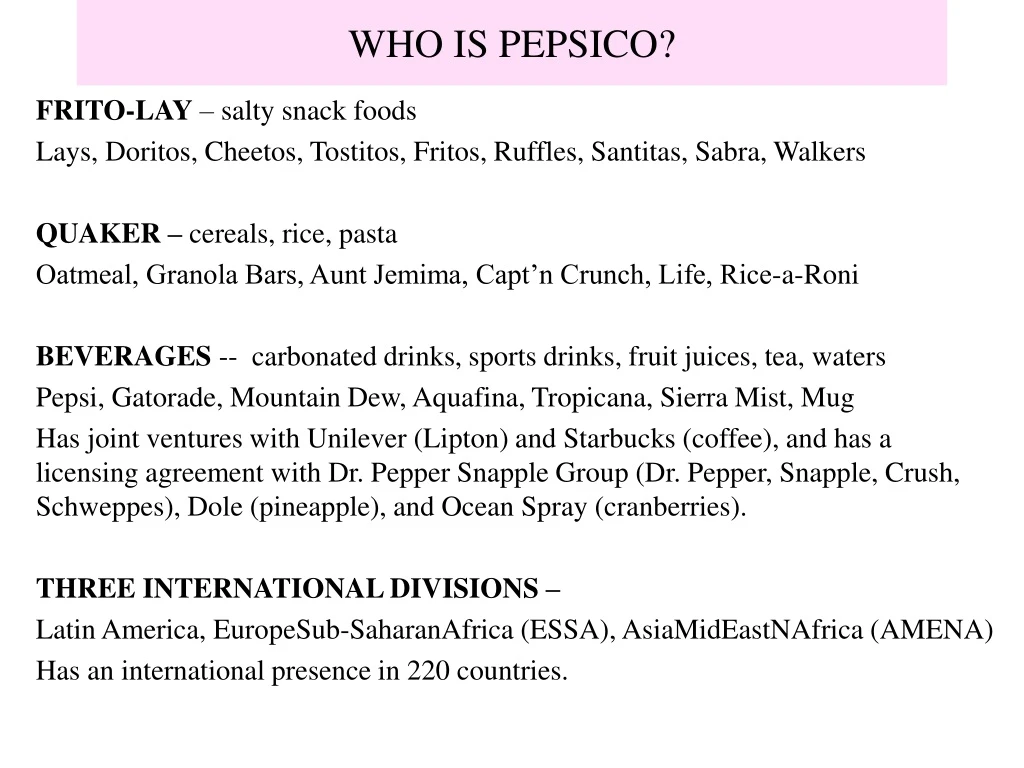
WHO IS PEPSICO? FRITO-LAY – salty snack foods Lays, Doritos, Cheetos, Tostitos, Fritos, Ruffles, Santitas, Sabra, Walkers QUAKER – cereals, rice, pasta Oatmeal, Granola Bars, Aunt Jemima, Capt’n Crunch, Life, Rice-a-Roni BEVERAGES -- carbonated drinks, sports drinks, fruit juices, tea, waters Pepsi, Gatorade, Mountain Dew, Aquafina, Tropicana, Sierra Mist, Mug Has joint ventures with Unilever (Lipton) and Starbucks (coffee), and has a licensing agreement with Dr. Pepper Snapple Group (Dr. Pepper, Snapple, Crush, Schweppes), Dole (pineapple), and Ocean Spray (cranberries). THREE INTERNATIONAL DIVISIONS – Latin America, EuropeSub-SaharanAfrica (ESSA), AsiaMidEastNAfrica (AMENA) Has an international presence in 220 countries.
Convenience Food Competitors in North America Manufacturer Market Share PepsiCo 25 % Kraft Foods 12 Hershey 9 Kellogg 6 Master Foods 5 General Mills 2 Proctor & Gamble 1 Private Label 7 Others 33 100
Soft Beverages Market in North America Category Gallons (in millions) Volume Share Carbonated Soft Drinks 14,707.4 48.1 % Bottled Water 8,822.4 28.9 Fruit Beverages 3,899.5 12.8 Isotonic Sports Drinks 1.355.1 4.4 Ready-to-drink Tea 875.1 2.9 Flavored/enhanced water 546.5 1.8 Energy drinks 302.6 1.0 Ready-to-drink Coffee 45.1 0.1 TOTAL 30,553.7 100.0
PEPSI Soft Drinks – Market Shares Country/Region Beverage Market Shares Middle East 75 % India 49 Thailand 49 Egypt 47 Venezuela 42 United States 39 Nigeria 38 China 36 Russia 24
PEPSI Salty Snacks – International Market Shares Country/Region Snacks Market Shares Mexico 75 % Holland 59 South Africa 57 Australia 55 Brazil 46 India 46 United Kingdom 44 Russia 43 Spain 41 China 16
PEPSICO – 22 Top Brands ( > $ billion revenue) Pepsi Cola $ 22.0 Lipton RTD Teas $ 3.05 Lays 9.0 Ruffles 2.75 Mountain Dew 7.5 Tostitos 2.55 Gatorade 7.3 Aquafina 2.1 Tropicana 6.1 Pepsi MAX 1.75 Diet Pepsi 5.65 Brisk 1.4 7 Up 4.8 Sierra Mist 1.4 Doritos 4.4 Fritos 1.4 Quaker Foods 3.5 Diet Mountain Dew 1.4 Cheetos 3.25 Starbucks RTD Bevs 1.1 Mirinda 3.2 Walkers 1.1
Macro/Societal Environment (PEST) POLITICAL - Government regulations regarding greenhouse gas emissions, mergers, etc. • Pending regulations on food snacks & sugar content in children’s food, etc. • Anti-American sentiment; deliberate attempts to limit trade ECONOMIC + Emerging consumer markets with disposable income in China and India • Stagnant/sluggish economic growth – worldwide • Financial instability in some international markets; causing runaway inflation • Currency fluctuations and a very strong US Dollar hurt overseas profits/trade SOCIO-CULTURAL + US residents eat snacks 2-3 times each day + Societal interest in health, exercise, and organic foods • Consumer interest in reducing intake of sugary drinks and salty snacks • Decline in demand for carbonated beverages in USA TECHNOLOGICAL + Development of better artificial sweeteners (Stevia/Monk Fruit) + Wearable “fitbit” devices to monitor sweating, need for electrolytes, calories
Competitive Environment • RIVALRY – Intense worldwide completion… primarily with Coca-Cola, DPSG, Kellogg, Kraft-Heinz, Mondelez, Monster, Nestle, Red Bull, and Snyder’s-Lance. • SUBSTITUTES – water, coffee, tea, bread, competitor products (Coke, etc) • BARRIERS TO ENTRY/EXIT – government regulation of beverages and food products; access to emerging markets and distribution channels; high capital investment in food processing factories and bottling plants. • CUSTOMER POWER – Very large supermarket chains and WalMart have significant bargaining power. • SUPPLIER POWER – Well-integrated supply chain; many suppliers are dependent/captive.
MARKET STRENGTHS/WEAKNESSES STRENGTHS Well-diversified, large focused brand portfolio; over 100 brands, 22 over $ billion/yr Concentric diversification enables synergy in marketing activities & distribution channels Number 1 in salty snacks worldwide, with a 25% market share in USA Number 1 in beverages in USA (39%) [Note: Coke is # 1 worldwide] Is the number 2 food and beverage company in the world (Nestle is # 1) Has a well-integrated supply chain and distribution network Using solar panels, alternative energy sources, compressed gas vehicles in facilities to curb carbon emissions/footprint Recent acquisitions to enter new markets: Russia’s leading juice company…Lebedyunsky VW Water and True North Nut snacks in UK; Lipton Teas agreement with Unilever Investment in international markets 2016 > $1 billion in China; > $500 million in India WEAKNESSES Too dependent on the US market; over 12% of all sales are with WalMart Hurt by bad publicity over Aquafina scandal, Aunt Jemima and Tropicana recalls International markets have been difficult to develop… some acquisitions have been poor. International profits are badly hurt by currency exchange rates and strong US dollar Some stockholders are pressuring PepsiCo to spin off the food divisions from beverages
STRATEGIC ASSESSMENT Through acquisitions, PepsiCo grew from primarily a beverage company into the second-largest food and beverage company in the world. Using a concentric-diversification strategy, they acquired businesses which were complimentary to their beverages… notably Frito-Lay (salty snacks), Taco Bell and Pizza Hut restaurants. While they weren’t necessarily experts on how to make pizzas or chips, they did know that they could sell their beverages to these same customers, so marketing and distribution channel synergies were achieved. Pepsi continued to acquire food and snack companies, and built a brand portfolio of over 100 products worldwide… most of which go well with one or more of their beverages. In the 1990’s it became apparent that the fast-food restaurant business was becoming very competitive, and with increasing stockholder pressure, Pepsi spun off its restaurants to YUM Co. (Taco Bell, Pizza Hut, Kentucky Fried Chicken). Since that time, the company has continued to focus on its core businesses… beverages and snack foods. Their current portfolio of products is so extensive that they don’t worry about consumer taste shifts or switching, because most consumers will simply switch from one Pepsi product to another product item owned by PepsiCo.
STRATEGIC ASSESSMENT - contd Current plans are to expand into global markets, particularly China and India, where the company will invest $ 1 billion and $500 million, respectively in 2016. Pepsi has also recently acquired the largest juice company in Russia, Lebedyansky, has acquired VW Water and True North Nuts in the UK, and has a new agreement with Unilever to distribute Lipton Tea. This international strategy is risky, given recent problems with currency instability and the strong US dollar. Over the last two years, PepsiCo has lost more than $2 billion due to political instability and the devaluation of the Bolivar in Venezuela. This has not only hurt corporate profits, but also threatens the financial stability of the entire firm if it continues (see Altman’s Z). Some new products soon to be introduced include a wearable “fitbit” and patch which monitors sweating and lost electrolytes. The Gatorade division will launch a “smart cap” bottle which senses your seating, and flashes when you need to drink more fluids/Gatorade. Obviously, this is something special for the health/fitness/athletic population.
STRATEGIC ASSESSMENT - contd Another product soon to be launched is ready to drink cold-brewed coffee. In partnership with Starbucks, PepsiCo will distribute in the US, and hopes to introduce it to China by the end of the year. By adding ginseng, taurine, acai berry, and guarana flavors to the brew, it is expected to have particular appeal in the Chinese market. Finally, Quaker Oats division is introducing a new product called Breakfast Flats, which is a type of crispy breakfast food particularly aimed at working women who are on the run. It will come in several flavors, cranberry/almond, banana honey-nut, and golden raisin/cinnamon. Test market results have been quite positive. In summary, PepsiCo continues to follow a strategy of growth through concentration and concentric diversification. They continue to add products that compliment their existing brands/lines, and they are actively trying to expand their market presence globally through acquisitions, mergers, and partnership agreements.
COMMON SIZE INCOME STMT - PEPSICO (in millions $) 2015 2013 2007 Frito-Lay North America 14782 23.4 14126 21.3 11586 29.4 Quaker Oats N America 2543 4.0 2612 3.9 1860 4.7 North America Beverages 20618 32.7 20083 30.2 10230 25.9 Latin America 8228 13.0 9335 14.1 Europe/SubSaharaAfrica 10510 16.7 13828 20.8 *15798 40.0 Asia/MidEast/NorthAfrica 6375 10.1 6431 9.7 OPER REVENUE 63056 100 66415 100 39474 100 Cost of Sales 28384 45.0 31243 47.0 18038 45.7 GROSS PROFIT 34672 55.0 35172 53.0 21436 54.3 Selling/Gen/Admin Exp 24885 39.5 25357 38.2 14208 36.0 Venezuela Impairment Costs 1359 2.2 --- --- Amortization Intangible Assets 75 0.1 110 0.2 58 0.1 OPERATING PROFIT 8353 13.2 9705 14.6 7170 18.2 Interest 970 1.5 911 1.4 224 0.6 Other Income or (Expense) 59 0.1 97 0.1 685 1.7 Income Before Tax 7442 11.8 8891 13.4 7631 19.3 Tax 1941 3.1 2104 3.2 1973 5.0 NET INCOME 5501 8.7678710.2 5658 14.3
PROFITS by DIVISION -- PEPSICO (in millions $) 2015 2013 2007___________ DIVISION Profit %/Total Profit %/Total Profit %/Total Frito-Lay NA 4304 51.5 3877 39.9 2845 39.7 Quaker Oats NA 560 6.7 617 6.4 568 7.9 NA Beverages 2785 33.3 2580 26.6 2188 30.5 International 2322 32.4 Latin America - 206 - 2.4 1617 16.7 Europe/SSAfrica 1081 12.9 1327 13.7 Asia/ME/NAfrica 941 11.3 1140 11.7 Corporate - 1112 - 13.3 - 1453 - 15.0 - 753 - 10.5 Operating Profit 8353 100 9705 100 7170 100
PEPSICO (in millions $) 2015 2013 2007 NET INCOME 5501 8.7 6787 10.2 5658 14.3 Net Income/Share $3.71 $4.37 $3.48 Dividends/Share $2.7625 74.4% $2.24 51.3% $1.42 40.8% Stock Price/Share (at year end) $99.92 $82.94 $77.32
COMMON SIZE BALANCE SHEET – PEPSICO (in millions $) 2015 2013 2007 Cash 9096 13.1 9375 12.1 910 2.6 Invest Securities 2913 4.2 303 0.4 1571 4.5 Receivables 6437 9.2 6954 9.0 4389 12.7 Inventory 2720 3.9 3409 4.4 2290 6.6 Other Curr Assets 1865 2.7 2162 2.8 991 2.9 TOT CURR ASSET 23031 33.1 22203 28.7 10151 29.3 Equipment (net) 16317 23.4 18575 24.0 11228 32.4 Other Property/Asset 30319 43.5 36700 47.3 13249 38.3 TOTAL ASSETS 69667 100 77478 100 34628 100 Current Liabilities 17578 25.2 17839 23.0 7753 22.4 LT Debt+Leases 29213 41.9 24333 31.4 4203 12.1 Other Liabilities 10846 15.6 10917 14.1 5438 15.7 TOT LIABILITIES 57637 82.7 53089 68.5 17394 50.2 Stockholder Equity 12030 17.3 24389 31.5 17234 49.8 TOTAL LIAB & SE 69667 100 77478 100 34628 100
CASH FLOW STATEMENTS - PEPSICO (in millions) 2015 2013 2007 Note: Net Income was… 5501 6787 5658 CASH PROVIDED FROM OPERATIONS 10580 9688 6934 CASH PROVIDED FROM INVESTING (3569) (2625) (3744) CASH PROVIDED FROM FINANCING (3828) (3789) (4006) Exchange Rate Changes ( 221) ( 196) 75 (Decrease)Increase FY 2962 3078 ( 741) Cash @ Beginning 6134 6297 1651 Cash @ End of Year 9096 9375 910
FINANCIAL ASSESSMENT PEPSICO2015 2013 2007 Current Ratio (CA/CL) 1.31 1.24 1.30 Tot Liabilities/Tot Assets .827 .685 .502 Tot Liabilities/SEquity 4.791 2.177 1.009 Inventory Turnover (COGS/Invent) 10.44 9.165 7.877 Avg Collection Period (ARx365/Sale) 37.3dys 38.2dys 40.6dys Asset Turn (Sales/TA) .905 .857 1.140 Net Profit (NI/Sales) .0872 .1022 .1433 ROA (NP/TA) .0790 .0876 .1634 Altman’s Z 1.76 2.05 3.20
FINANCIAL TRENDS POSITIVE TRENDS Cash is increasing Revenue + profits are up for Frito-Lay and NA Beverages Dividends have been increased WORRISOME TRENDS Revenue + profits are down in all international divisions Big problem in Venezuela… impairment costs > 2 Billion/2 yrs Operating profits and Net profit are both down Long-term debt is up; Debt/Asset ratio is too high Stockholder Equity is way down…why? Interest expense is up Altman’s Z is getting critically low…
SCENARIO 1 - PESSIMISTIC OUTLOOK Over the next three to five years, the world economy remains stagnant, with little disposable income growth. England exits the European Union, creating more economic and financial uncertainty. Interest rates creep up as the US Federal Reserve raises concerns about inflation. The US dollar remains strong relative to other currencies, creating more currency fluctuations and uncertainties for US companies. Disputes with China and Russia continue to muddle trade growth with those countries. The public interest in exercise and health grows, and laws are passed banning sugar in sodas and limiting salt in snacks, especially for children. Sales of carbonated soft drinks in the US continue to decline. Demand remains very modest for fruit juices, energy drinks and snacks, and natural sweeteners. Coke overtakes Pepsi in the North American soft drink market, and Dr. Pepper launches a snack foods division to compete with Frito-Lay.
SCENARIO 2 – OPTIMISTIC OUTLOOK Over the next three to five years, the world economy rebounds significantly, with notable gains in income and trade. Interest rates remain low, as a new Republican administration takes control of the US Federal Reserve. The US dollar remains relatively strong compared to other currencies, but currency fluctuations diminish and uncertainties in the European Union subside as England decides to stay in the Eurozone. China and Russia enact favorable legislation that encourages foreign investment and trade growth. The public interest in exercise and health continues to grow, and demand for healthy snacks, energy drinks, fruit juices and natural sweeteners explodes. Sales of carbonated soft drinks stabilize in the US, and show signs of increasing growth in Brazil, China, and Russia. The RTD coffee market in China expands rapidly, as ginseng and acai berry flavors really catch on with the public. Pepsi maintains its dominance in the North American soft drink market, and Quaker Oats Breakfast Flats is a big hit with the working women in the USA. Dr. Pepper launches a snack foods division, but only gains a 1.5% market share.
SCENARIO 3 – MOST LIKELY OUTLOOK Over the next three to five years, the world economy rebounds gradually, and disposable income increases modestly worldwide. Interest rates remain relatively low, as fears of inflation ease. The US dollar remains relatively strong compared to other currencies, but currency fluctuations and uncertainties continue, with the departure of England from the European Union. Trade with China continues to muddle along, as their economy switches over from an export economy to domestic consumption. Trade growth with Russia continues to be impaired because of ongoing disputes over the Ukraine and Russia’s involvement in the Syrian conflict. While there is public interest in exercise and health, no legislation is enacted about sugary drinks or salty snacks. A notable segment of the population wants healthy snacks, energy drinks, fruit juices and natural sweeteners, so that market is expected to grow in the US. Sales of carbonated soft drinks stabilize in the US, and soft drinks and the RTD coffee market in China are expected to grow significantly. Pepsi will maintain its dominance in the North American soft drink market, but their international divisions will continue to face difficulties and market challenges.
KEYS TO SUCCESS – A Comparison PEPSI Coca-Cola Dr. Pepper/Snapple Broad Product Portfolio 8 5 6 New Products Introduced 6 7 5 Efficient Operations 8 8 7 Strong Marketing/Sales 8 9 6 Good Distribution Channels 8 9 6 International Market Share 6 8 7
STRATEGY – For the Next 3-5 Years Continue to find/acquire/launch new products which fit concentrically with Pepsi’s existing portfolio of brands. Launch the healthy snacks and drinks, and start using stevia and other natural sweeteners which appeal to the health-conscious public. Consider exiting markets where the economy is in chaos, like Venezuela. This operation has cost the company $2 billion in lost profits over the past few years. Maybe this is a place we don’t need to be, even if we have a 42% market share there. Cautiously pursue the China market. Certainly it has huge potential, but will the RTD coffee be a big hit? There is plenty of room to grow both traditional soft drinks and salty snacks in China, where we currently have just 36% of the soft beverages and only a 16% of the salty snacks market. Reduce long-term debt, which seems to be a burden the company doesn’t need right now, given the uncertainty in the international marketplace. Keep the North American beverages and snacks divisions healthy, and try to improve performance in the international divisions.