Download
1 / 4
0 likes | 24 Views
<br>Dive into the essential strategies for crafting effective Business Intelligence reports. Uncover the best practices for design and implementation to elevate your BI reporting game today.

E N D
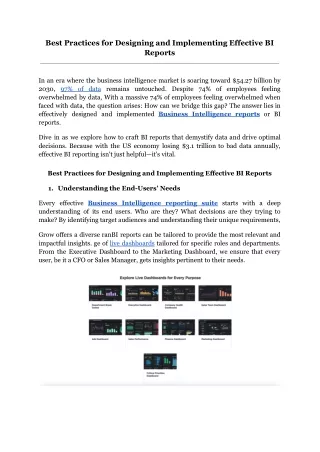
Best Practices for Designing and Implementing Effective BI Reports In an era where the business intelligence market is soaring toward $54.27 billion by 2030, 97% of data remains untouched. Despite 74% of employees feeling overwhelmed by data, With a massive 74% of employees feeling overwhelmed when faced with data, the question arises: How can we bridge this gap? The answer lies in effectively designed and implemented Business Intelligence reports or BI reports. Dive in as we explore how to craft BI reports that demystify data and drive optimal decisions. Because with the US economy losing $3.1 trillion to bad data annually, effective BI reporting isn't just helpful—it's vital. Best Practices for Designing and Implementing Effective BI Reports 1. Understanding the End-Users’ Needs Every effective Business Intelligence reporting suite starts with a deep understanding of its end users. Who are they? What decisions are they trying to make? By identifying target audiences and understanding their unique requirements, Grow offers a diverse ranBI reports can be tailored to provide the most relevant and impactful insights. ge of live dashboards tailored for specific roles and departments. From the Executive Dashboard to the Marketing Dashboard, we ensure that every user, be it a CFO or Sales Manager, gets insights pertinent to their needs.
2. Clean and Quality Data: The Foundation of Good Reporting Before any BI reporting tool can work its magic, the quality of the data it's fed is paramount. Through rigorous ETL (Extract, Transform, Load) processes, data should be cleansed, transformed, and validated. This ensures that Business Intelligence reports are free from discrepancies that could potentially mislead users. Remember, even the most advanced Business Intelligence reporting suite is only as good as the data it processes. Leverage Grow’s robust ETL processes to ensure your data is cleansed and validated, laying the foundation for impeccable reporting. 3. Designing with Clarity and Focus Within the realm of BI reports, the concept of "less is more" often reigns supreme. The goal is to present data clearly, avoiding visual clutter. Depending on the information, the right visualization - be it charts, graphs, or tables - should be selected. And by employing consistent color schemes, fonts, and layouts, BI reporting becomes more intuitive, leading to swifter decision-making. Grow's customizable dashboard designs keep clarity at the forefront, allowing users to swiftly interpret and act on data. 4. Responsive and Interactive Reports Gone are the days when BI reports were static, lifeless sheets. Modern Business Intelligence reports are dynamic, adapting to various devices and allowing users to engage through interactive filters, sliders, and drill-downs. This level of interactivity, provided by today’s Business Intelligence reporting suite, empowers users to explore data on their terms, diving deeper where necessary. Experience interactive BI like never before with Grow’s dynamic report interfaces, enhancing user data exploration. 5. Delivering Timely and Real-Time Insights In the fast-paced world of business, data from yesterday can sometimes be obsolete. This highlights the significance of real-time data in BI reporting. Integrating APIs and other data streams can ensure reports reflect the most current state of affairs. However, while real-time Business Intelligence reports are powerful, it's essential to address the unique challenges they present, such as ensuring data accuracy on the fly. With Grow's advanced integration capabilities, stay updated with real-time data that's relevant and timely.
6. Narrating a Story with Your Data Data in isolation has little meaning. But when woven into a narrative within BI reports, it has the power to inspire action. Context gives numbers life, allowing decision-makers to grasp the broader implications of what they're seeing. This storytelling approach is a hallmark of an effective Business Intelligence reporting suite. Use Grow to turn data points into compelling narratives, adding context and driving decision-making. 7. Incorporate Feedback Loops Feedback isn't just valuable; it's vital. Regularly collecting responses from end-users ensures that BI reporting remains relevant and addresses ever-evolving business needs. By continually refining and iterating, a Business Intelligence reporting suite stays agile and aligned with organizational goals. 8. Security and Compliance As data breaches become more common, securing BI reports is of utmost importance. Restricting access through roles and permissions is crucial. Additionally, with regulations like GDPR and CCPA, ensuring data compliance within BI reporting is not just best practice—it’s often the law. Rest easy knowing that Grow prioritizes security and compliance, safeguarding your data and ensuring adherence to global regulations. For further insights and validation, refer to Grow.com Reviews & Product Details G2. 9. Continuous Training and Education As with any tool, a Business Intelligence reporting suite is only as effective as its users. Regular training sessions, workshops, and seminars can ensure that users are leveraging the full potential of their BI reports. This, coupled with staying updated on the latest BI reporting techniques, ensures the best possible outcomes. 10. Performance Optimization User satisfaction is closely tied to how quickly they can access insights. Optimizing query performance, reducing data retrieval times, and balancing the detail with performance ensures that BI reports not only inform but do so promptly. Grow ensures optimal performance, minimizing wait times and delivering swift insights for your strategic moves.
Conclusion From understanding intricate user needs to ensuring top-notch performance and security, effective BI reporting is a multifaceted endeavor. In a data-driven world, the importance of an optimized Business Intelligence reporting suite cannot be overstated. As ShipMonk expanded, they faced scattered data and reporting challenges. After integrating with Grow, they efficiently tracked crucial metrics in real-time, leading to significant operational improvements. Kevin Sides, CMO of ShipMonk, remarked: “Grow saves us a ton of time and headaches... It’s just been such a positive experience seeing our reports right there for us each day.” Reflecting on these insights, where does your BI reporting strategy stand? Let's continually evolve and harness the power of data together.