Download
1 / 137
1.37k likes | 1.39k Views
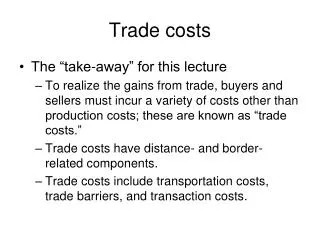
This report explores the relationship between shipping costs and trade connectivity, highlighting the importance of lower transport costs, better services, and increased competition in driving trade volumes. It discusses the challenges of high transport costs and low service levels and emphasizes the need to initiate a virtuous circle of transport costs, connectivity, and trade. The report also examines the role of economies of scale, competition, and port characteristics in shaping maritime freights.

E N D
Shipping Costs, Connectivity, and the Geography of Trade Jan.Hoffmann@UNCTAD.org Geneva, May 2008.
TradeVolumes Transport Services Transportcosts
Lower Transport Costs -> More trade -> Economies of scale -> Lower Transport Costs
Better services -> More trade -> More income to finance infrastructure -> Better services
More trade -> More shipping supply -> More competition -> lower freights -> More trade
The challenge: • Avoid a vicious circle, where high transport costs and low service levels discourage trade, which will further endear transport and reduce connectivity… • Instead: Initiate a virtuous circle
Transport CostsConnectivityTrade Geneva, May 2008 Jan.Hoffmann@UNCTAD.org
Transport CostsConnectivityTrade Geneva, May 2008 Jan.Hoffmann@UNCTAD.org
Trade Volumes* Transport Services* Transport costs* * Containerized maritime
TradeVolumes Transport Services ? Transportcosts
Global trademerchandise and services, annual growth Source: WTO
Freight as % of goods value UNCTAD, Review of Maritime Transport
Doubling the distance leads to a increase of maritime transport costs (incl. insurance)by about 15-20%… averages, empirical dataECLAC, FAL 191, Wilmsmeier, HoffmannHandbook of Maritime Economics, Kumar, Hoffmann Distance
Freight rates and Distance in the Caribbean, July 2006 Source: Hoffmann, Wilmsmeier, IAME 2007, partly with data from Lester Hernandez, MEL
moving 10 000 tons instead of 100 (in one transaction) reduces unit costs by around 43% Economies of Scale
Trading 10 million instead of 1 million tons per year reduction of transport costs by around 6% Total bilateral trade
Economies of Scale CRS, April 2008
Ship sizes • 27.- US$ saving/ container/ tripusing “post panamax” versus “panamax” (Drewry)
Mergers of shipping companies • Savings thanks to larger volumes(Roland & Berger)
Port operations • 12 US$ per move savings with global operatorsDrewry
Imbalances CI-Online February 2008
Supply/demand Trans-Pacific trades Chart from Peter Faust, April 2008
Imbalances CI-Online February 2008
Supply/demand Asia-Europe trades Chart from Peter Faust, April 2008
Imbalances CI-Online February 2008
Imbalances • In the Caribbean, which freight rates would you expect to be higher: • Those for imports, or • Those for exports ?
Increase the value by 1% implies an increase of transport and insurance costs by around 0.36% Merchandize value
If countries are neighbours, with paved roads, maritimetransport costs are around 10% lower Competition with land transport Fotos: Jan Hoffmann
Receiving 20 instead of 5 companies freights go down by around 12% Competition between carriers
Competition between carriersCase study Caribbean • If the company itself has no direct service (i.e. it only has a service with transshipment): This company’s freight rate + $650 • If other, competing, companies do provide a direct service: This companies freight rate - $425
Competition between carriersCase study Caribbean Source: Hoffmann, Wilmsmeier, IAME 2007
Difference between “best” and “worst” case in Latin America: 25% of worst case Port reform
Dependent variable: maritime transport costs per tonne of containerizable cargo Wilmsmeier, Hoffmann, Sanchez, in: Porteconomics, 2006
Dependent variable: maritime transport costs per tonne of containerizable cargo Better port infrastructurereduces maritime transport costs
Dependent variable: maritime transport costs per tonne of containerizable cargo Better (perceived)port efficiencyreduces maritime transport costs
Dependent variable: maritime transport costs per tonne of containerizable cargo Better general transport infrastructure does NOT reduce maritime transport costs
Dependent variable: maritime transport costs per tonne of containerizable cargo Port privatization in the EXPORTING country reduces maritime transport costs
Dependent variable: maritime transport costs per tonne of containerizable cargo Trade facilitation in the IMPORTING country reduces maritime transport costs
Dependent variable: maritime transport costs per tonne of containerizable cargo Better connectivity between ports/ more competition among carriersreduces maritime transport costs
Distances Type & value of goods Imbalances To sum up: Differences in maritime freights depend on… • Competition • Economies of scale • Port characteristics
Changes over time Hoffmann, IAME conference proceedings, Cyprus, 2005
“Is there a pig cycle in container shipping?” Coase and Fowler (1935a)
Pork meat is expensive: the farmer “orders” piglets Data from Clarksons Research
The model of a cycle ORDERSt = CHARTERRATEt CHARTERRATEt = (1/DELIVERIESt ) DELIVERIESt = ORDERSt-24
![IV. Various Costs of Trade and Trade Arrangements Direct and indirect costs of trade [Head, 59-90; R/H, 159-168]](https://cdn0.slideserve.com/22356/slide1-dt.jpg)