Data completeness reporting
Data completeness reporting. Alex Hodsman, David Bull, Paul Dawson UK Renal Registry. Why is complete data important? How can data completeness be improved?. Epidemiology. Describe patterns of health and disease in populations Identify cause of disease

Data completeness reporting
E N D
Presentation Transcript
Data completeness reporting Alex Hodsman, David Bull, Paul Dawson UK Renal Registry
Why is complete data important? • How can data completeness be improved?
Epidemiology • Describe patterns of health and disease in populations • Identify cause of disease • Measure need for health services, their use and effects
Exposure Outcome Lorry Driving Lung cancer Smoking Confounder
Exposure Outcome Dialysis modality - HD Death Old age Confounder
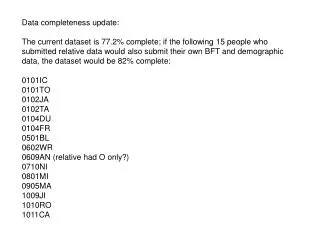
Problems Fewer patients/centres in study Introduce bias as characteristics of those with missing data unknown Solutions Exclude patients from study Statistical techniques to make a ‘educated guess’ about characteristics (imputation) Missing data
Or…………… Improve data quality
Plan • Improve: • Timeliness of data return • Data completeness
Do -timeliness • To be sent quarterly – 2 months after data collection commences
Do –Data completeness • User friendly • Key areas • Incident and prevalent patients • Dialysis and transplant patients • Patient numbers • Demographic factors • Quality of care indices
Patient numbers • New patients (All RRT) • Prevalent patients – HD, PD, Transplant • Deaths
Demographics • All RRT – incident and prevalent • Ethnicity • Co-morbidity • Primary diagnosis • Referral data
Dialysis patients URR Phosphate Haemoglobin PTH Blood pressure Transplant patients Haemoglobin eGFR Blood pressure Phosphate Quality of care indices
Study – Data completeness • In addition to current completeness report • Single side of A4 • Pilot to Clinical Directors via CD forum • Ready to test in RRT centres • Send to IT manager and Clinical Director
Please……….. Feedback your comments to the UKRR