MR Spectroscopy
MR Spectroscopy. Ellen G. Hoeffner, MD Neuroradiology Division Department of Radiology University of Michigan Health System. MR Spectroscopy. Review technique and major metabolites Review application of MRS mainly as it relates to primary brain tumors. Techniques.

MR Spectroscopy
E N D
Presentation Transcript
MR Spectroscopy Ellen G. Hoeffner, MD Neuroradiology Division Department of Radiology University of Michigan Health System
MR Spectroscopy • Review technique and major metabolites • Review application of MRS mainly as it relates to primary brain tumors
Techniques • Single-voxel spectroscopy • 3 orthogonal slice selection pulses are used to select a signal from region where the voxels intersect • Voxel 4 cm3 – 8 cm3 • 2 techniques commonly used • PRESS (point resolved spectroscopy) – a spin echo based technique • STEAM (stimulated echo acquisition mode) – a stimulated echo based technique
PRESS STEAM • Advantages • Most commonly used • Double the SNR • Disadvantages • Can not use very short TE • Best for observing resonances with longer T2s • Advantages • Better slice profile • Can use shorter TE • Disadvantages • Lower SNR • Best for observing resonances with shorter T2s
Multivoxel technique • MR spectroscopic imaging (MRSI) or chemical shift imaging (CSI) • Simultaneously acquire many voxels and a spatial distribution of the metabolites • Metabolic heterogeneity can be assessed • Can use PRESS or STEAM sequence (PRESS more common)
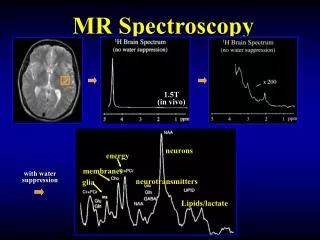
Metabolites • Normally detected compounds by proton MRS • Long echo times (TE 140 or 280 ms) • Cho (choline) • Cr (creatine) • NAA (N-acetylaspartate) • Short echo times (TE 40 ms or less) • Glx (glutamate, glutamine) • mI (myo-inositol) • Lip (lipids)
Metabolites • N-acetyaspartate (NAA) • Largest signal normal peak in adult brain • Marker of neuronal and axonal viability and density • Synthesized in neuronal mitochondria and transported into cytoplasm and along axons • Peak is at 2.02 ppm • Second and third peaks may be seen at 2.6 and 2.5 ppm
Metabolites • NAA • Decreased or absent NAA - decreased viability and number of neurons • Neuronal destruction from malignant neoplasms and many white matter diseases • Inverse relationship between NAA concentration and glioma grade • Absence of NAA in intra-axial tumor • Metastasis or non-neuronal tumor • Highly malignant glioma destroying all neurons • Increased in Canavans disease and possibly in Salla disease and Pelizaeus-Merzbacher disease
Metabolites • Creatine (Cr) • Composite peak consisting of creatine and phospocreatine • Compounds involved in energy metabolism via creatine kinase reaction generating ATP • Marker of energetic systems and intracellular metabolism • Concentration assumed relatively constant • Internal reference for calculating metabolite ratios • May be decreased in high grade gliomas due to higher metabolic demands • Peak is at 3.02 ppm
Metabolites • Choline (Cho) • Composite peak with contributions from choline and choline containing compounds (phosphocholine) • Involved in membrane synthesis and degradation • Marker of cellular membrane density, integrity and turnover • Peak found at 3.22 ppm
Metabolites • Cho • Elevated choline • Tumors - elevated membrane turnover; correlate with degree of malignancy, reflecting cellularity • Active demylination – degradation of myelin phopholipids or inflammation • Infarction – from gliosis or ischemic change to myelin • Infectious and inflammatory lesions • Low levels seen in hepatic encephalopathy
Metabolites • Myo-inositol (Myo) • Simple sugar considered glial marker • Mainly synthesized in glial cells • Peak at 3.5-3.6 ppm • Increase in Myo represents glial proliferation or an increase in glial size • Elevated in low grade gliomas • Also elevated in Alzheimer’s dementia, demyelinating diseases, gliosis, astrocytosis • Reduced in hepatic encephalopathy
Metabolites • Lipids (Lip) • Components of cell membranes with very short TE • 2 lipid peaks occur • Methylene protons at 1.3 ppm • Methyl protons at 0.9 ppm • Absent in normal brain • May see if there is contamination of voxels from adjacent fatty tissue • Lipid peak seen with cellular membrane breakdown or necrosis
Metabolites • Lipids (Lip) • Elevated lipids • Tumors – high grade primary tumors, mets, lymphoma • Abscesses and inflammatory processes • Radiation necrosis
Metabolites • Lactate (Lac) • Small peak physiologic in newborms in first hours of life, otherwise not usually seen • Peak is a doublet at 1.33 ppm • Above baseline on short/long TE • Below base line at TE of 135-144 msec • Increased lactate • Anaerobic metabolism such as cerebral hypoxia, ischemia, seizures, metabolic disorders (especially mitochondrial) • Macrophage accumulation as seen in acute inflammation • Tissue with poor washout such as cysts, hydrocephalus and necrotic and cystic tumors
Clinical Applications • Grading of glial neoplasms • Differentiate recurrent or residual brain tumor from post-therapy changes (e.g., delayed radiation necrosis) • Differentiate brain tumor from other non-tumor diagnoses
Spectral Pattern of Glial Tumors • Increase in Cho • Increased Cho/Cr and Cho/NAA ratios • Reduction of NAA • Reduced NAA/Cr ratio • Increased lactate • Increased lipids • Reduction in Cr level • Myo/Cr is usually higher in lower grade tumors than higher grade
Tumor Grading • Most studies have shown association between Cho and tumor grade • Exception, GBM may have lower Cho levels than grade II or III gliomas due to necrotic core
Tumor Grading • Threshold values for metabolite ratios have been suggested for distinguishing between low and high grade gliomas, but are not well established • Cho/Cr ratio of 1.56 (AJNR 2003;24:1989–1998) • 76% sensitivity and 48% specificity • Cho/NAA ratio of 1.6 (AJNR 2003;24:1989–1998) • 73% sensitivity and 63% specificity
Tumor Grading • Other studies have used automated techniques or variations of Cho/NAA ratio to try to distinguish low from high grade tumors • Other groups have suggested a Cho/Cr ratio of 2 or 2.5 to distinguish between low grade and high grade glioma (Neuroimag Clin N Am 2013;23:527-55) • Minimum NAA/Cr also highly correlated with tumor grade
Tumor Grading • Presence of lipids and lactate correlates with necrosis in high grade tumors • Increase in lipid and lactate is inversely related to survival • Elevated lipid peak also seen with mets and lymphoma
Cho/Cr – 1.37 Cho/NAA – 1.49 NAA/Cr – 0.92 Cho/Cr – 0.95 Cho/NAA – 0.48 NAA/Cr – 1.99
Cho/Cr – 3.76 Cho/NAA – 9.91 NAA/Cr – 0.39
Cho/Cr – 0.97 Cho/NAA – 0.35 NAA/Cr – 3.22 Cho/Cr – 1.41 Cho/NAA – 0.60 NAA/Cr – 2.34
Residual/Recurrent Tumor vs Post-treatment Change • Radiation necrosis • Significantly reduced Cho and Cr levels • Increased lipid and lactate levels • Recurrent tumor • Increased Cho, Cho/NAA and Cho/Cr levels and lower NAA/Cr levels
Residual/Recurrent Tumor vs Post-treatment Change • Overlap can occur between tumor and radiation changes • Increase in Cho may be see after radiation due to cell damage and astrogliosis • Both tumors and radiation change have low NAA due to neuronal damage • Tumor and radiation change can co-exist
MR Spectroscopy • May be helpful in • Grading primary tumors • Differentiating recurrent tumor from post treatment change • Differentiating tumor from other diagnoses • Overlap exists • May be integrated into a protocol with conventional MRI, DWI and perfusion imaging in patients with intra-axial masses Radiology 2007;243:539–50