Download
1 / 37
370 likes | 400 Views
Explore the history, methods, and analysis techniques of seasonal forecasts, focusing on potential predictability, signal variance, and forecast skill for climate prediction. Learn about ensemble forecasts, decomposition of meteorological variables, and the importance of SST forced variability in seasonal forecasting. Discover how to estimate potential predictability and utilize probability forecast information for various applications.

E N D
Seasonal Forecasts and Predictability Masato Sugi Climate Prediction Division/JMA
History of Seasonal Forecasts at JMA 1942 Statistical One-month and Three-month forecasts 1943 Statistical Warm/Cold season forecasts 1996 Dynamical One month forecast 1999 El Nino Outlook with CoupledModel 2003 Dynamical Three month forecast Dynamical Warm/Cold season forecasts
Operational models for seasonal forecasts at JMA One month forecasts : AGCM with persistent SSTA T106L40 GSM0103 26 member Three month forecasts: AGCM with persistent SSTA T63L40 GSM0103 31 member Warm/Cold season forecasts: Two tier method T63L40 GSM0103 31 member using SSTA predicted CGCM02
Seasonal Forecasts Issuance time Forecast period Lead time Forecast range Forecast range Lead time Forecast period 1 month 0 - 2 week 1 - 4 week 3 month 0 - 2 month 1 - 3 month 6 month 0 - 3 month 3 month
Analysis of Variance (ANOVA) Decomposition of meteorological variable: If and are statistically independent, then Variance explained by the i-th component : correlation between and
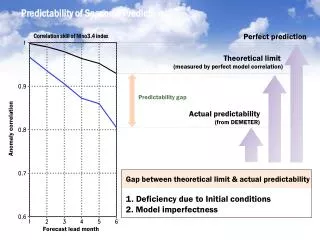
Decomposition of observed variable : predictable signal : unpredictable noise : variance of signal : variance of noise Potential predictability Potential predictability gives the upper limit of forecast skill.
: Predictable signal : Unpredictable noise Variance noise variance climatological total variance signal variance Forecast lead time
Predictable signal and unpredictable noise • Predictable signal: - some low-frequency internal modes • - externally forced slowly varying modes • - decadal modes • - trends due to global warming • Unpredictable noise: - high-frequency internal modes • - most low-frequency modes that have • strong interaction with high-frequency modes In seasonal forecasts, most important predictable signal is SST forced variability.
Ensemble forecasts - starting from slightly different initial conditions - with the same boundary condition (SST)
Estimating potential predictability R from ensemble simulation : simulated variable : predictable signal : unpredictable noise : ensemble mean : deviation from potential predictability
Ensemble simulation experiment - MRI-JMA98 AGCM T42L30 - GISST 1949 - 1998 - 6-member, 50-year simulation
JJA DJF
PN PA PB 33% 33% 33% 0.43c - 0.43c 0 Three-Category Forecast Climatological PDF PA : probability of Above normal PN : probability of Normal PB : probability of Below normal
Probability of three categories Forecast PDF xs - 0.43c 0 0.43c PA : probability of Above normal PN : probability of Normal PB : probability of Below normal
Deterministic category forecast Category of highest probability Forecast category Forecast PDF Percent Correct (Pc) : percentage of correct forecast
0.0 0.0 1.0 33 % • 0.01 0.1 0.995 36 • 0.04 0.2 0.980 39 • 0.09 0.3 0.954 42 • 0.1 0.316 0.949 43 • 0.16 0.4 0.917 46 • 0.2 0.447 0.894 47 • 0.25 0.5 0.866 49 • 0.3 0.548 0.837 51 • 0.36 0.6 0.800 54 • 0.4 0.632 0.775 55 • 0.49 0.7 0.714 58 • 0.5 0.707 0.707 59 • 0.6 0.775 0.632 63 • 0.64 0.8 0.600 65 • 0.7 0.837 0.548 68 0.8 0.894 0.447 73 0.81 0.9 0.436 74 • 0.9 0.949 0.316 82
Overall skill of seasonal forecasts for seasonal mean temperature over Japan Percent correct of three category forecasts: 40~50% This value corresponds to the correlation between ensemble mean and observation: 0.23~0.52 Even though the percent correct is 40~50% probability forecast is still useful.
For example, if percent correct is 47% , then correlation is 0.44, s = 0.44c , n = 0.90c . If forecast ensemble mean Xs = 0.4 c , then Climatological PDF Forecast PDF
If potential predictability is 50% , then correlation is 0.707, s = 0.707c , n = 0.707c . If forecast ensemble mean Xs = 0.7 c , then Climatological PDF Forecast PDF
Summary • In seasonal forecasts , it is important to understand the predictability and intrinsic uncertainty. • Potential predictability is generally high in the tropics but low in the extratropics. • Although there is a large uncertainty in seasonal forecasts, the forecast probability information is still potentially useful. • Application technology of probability forecast to agriculture, water management, health, energy, etc., need to be developed.
Estimation error in R due to model deficiency underestimated overestimated overestimated underestimated
A proposal for estimating model independent potential predictability
Ensemble mean for large ensemble size We further assume then
correlation RMSE
Perfect model Climatology forecast
Ensemble mean better skill because Perfect model
Multi model ensemble mean better skill when
Multi model ensemble mean If and for all i then
Multi model ensemble mean if but then weighted average improves the skill
Estimating from multi model ensemble simulations if
Summary By using multi-model ensemble simulations we can estimate 1) model independent signal variance and potential predictability, 2) signal amplitude and model error variance for each model, 3) optimum weight for multi-model ensemble