Download
1 / 85
860 likes | 1.1k Views
Seasonal predictability and its relation to ENSO. Valentina Pavan. Outline. What is a seasonal forecasts? Available products Modes of large-scale variability in the tropics : ENSO, its predictability and its impacts on global climate. What is a seasonal forecast?.

E N D
Seasonal predictability and its relation to ENSO Valentina Pavan
Outline • What is a seasonal forecasts? • Available products • Modes of large-scale variability in the tropics : ENSO, its predictability and its impacts on global climate
What is a seasonal forecast? A seasonal forecast is NOT a weather forecast!! It is a climate forecast and it’s target is to evaluate the probability of occurrence of climate anomalies in the next season. Although everybody would like to know the amplitude of the anomaly, more often than not, it is even difficult to predict its sign.
Climate ……. Climate of a region is defined as the average of the observed local weather condition over a long period of time. Ideally, it is defined over periods of at least 30 years. It is described by giving the local mean values of temperature, precipitation, surface wind and humidity, but also the frequency of extremes of the same.
….climate indices… Climate indices are built starting from daily values of surface parameters: • seasonal mean of an observable (Tmin, Tmax) • accumulated precipitation over 3 months • Nth percentile of an observable. Ex: 10th percentile of Tminover the season (TN10) • Frequency of threshold trespasses. Ex: Tmin lower than TN10 or lower than a fixed value (0°)
…and climate anomalies Each index is evaluated over the season and then averaged over the year to obtain the typical value assumed in a region. So that the value of an index in a specific season can be written as is called climate anomaly.
Climate, climate anomalies and seasonal forecasts When issuing a seasonal predictions it is important: • to have a precise idea about the value of for the specific season and for the location; • to evaluate the model and the local climate over the same period of time; • to focus on the climate anomaly, primarily on its sign, giving probability of occurrence of events, keeping in mind model skill scores and specific applications.
Variability of climate anomalies Variability of climate anomalies can be decomposed in two parts: • a slowly varying component (persistence) interannual variability • a quickly varying component (between decades, months - blocking…..) interannual + intra-seasonal variability
Climate anomalies and their predictability What can be predicted: • Part of the slowly varying component linked with the occurrence of slowly varying changes in boundary conditions (SST tropical anomalies, El Nino, changes in snow cover or sea ice extension,….) • Part of the quickly varying component linked with predictable transient tropical anomalies like the Madden Julian Oscillation
Why predictable? These climate anomalies are predictable because they are linked with dynamical features presenting a very slow evolution speed. the longer the persistence, the higher the predictability Ex: typical group velocity of tropical ocean anomalies is of the order of months predictable Extratropical surface ocean anomalies move much more quickly mostly unpredictable
Which model should be used? Most of these slowly varying modes of variability include non-linear feed-backs between different systems or propagation of waves (ex: atmosphere-ocean, troposphere-stratosphere,...) Seasonal forecasts are best produced using coupled models (ocean+atmosphere), with high top (upper level in high stratosphere) and, if possible, dynamical sea ice and snow cover.
How to use models? Models are initialised and then run for several months. It is crucial that all parts of the system are initialised: atmosphere, ocean, cryosphere…..BUT initial conditions are not very relevant for all systems. The forecasts are always probabilistic so as to cover all possible realizations of a climate anomaly. The ensemble is obtained either by perturbing the initial conditions, or using different initialization times, or perturbing the physics.
How to use the forecasts • Single forecasts, even mean values, have very little meaning in seasonal predictions. It is important to focus always on the probability of occurrence of a specific event. • When issuing a seasonal forecast, it is better to focus on seasonal climate indices, without mentioning differences between specific months or even weeks: up to now, at these shorter time scales, no skill has been identified. • A correct evaluation of the skill of seasonal predictions should not include the first 15 days of integration due to strong dependence on initial conditions. • Evaluate forecast skills using at least about 20 predictions obtained using the same model version initialised in the past (hindcasts o reforecasts), and specific parameter/season. • Attribute forecast skills to specific sources of predictability and evaluate the relevance of information in the specific time considered
Statistical methods When describing the ensemble prediction • Use median in stead of mean (more stable with respect to outliers) • Use inter-quartile range (75°-25°) in stead of variance • Use terciles (lower, central, upper) although you must accept that often best you can do is exclude probability of occurrence of one tercile(lucky if it is not the central one!!).
Measures of skill The forecast to beat in this case is climate. • Mean bias of model. • Mean correlation. • Root Mean Square Error (RMSE). • Brier Score and Brier Skill Score with respect to climate for positive/negative anomaly events. • Other probability scores (ROC, GROC, ….).
Which model deficiencies? • Representation of mean climate due to • Low horizontal resolution land-sea mask, orography, land-use • Dynamical representation of atmosphere poor representation of small scale dynamics • Representation of interannual variability • Inability to represent some dynamical features • Incorrect representation of connections between different part of the system
Advantages of multi-model ensembles Different models have skills and deficiencies at modelling different aspects of climate. The best way to reduce the impacts of model deficiencies and improve predictive skills is to use multi-model ensembles. Simple multi-model ensemble predictions are obtained debiassing each model (computing anomalies for each model with respect to its own climate).
Seasonal forecast products • IRI: http://iri.columbia.edu/ • Multi-model products and maps and verification • ENSO plumes + ENSO quick look • ECMWF: http://www.ecmwf.int • Single model maps and ENSO plumes • EUROSIP multi-model products (only member states) • NOAA: http://www.cpc.ncep.noaa.gov/ • MJO conditions and predictions, with useful expert comments • El Niño conditions and predictions, with useful expert comments
Evaluation of local seasonal forecasts Evaluate predictability linked with known modes of interannual variability: • IF linear behaviour Maps of correlations between large circulation climate indices and local climate anomalies • IF non linearities Probability of occurrence of terciles of climate anomalies under occurrence of index ‘events’
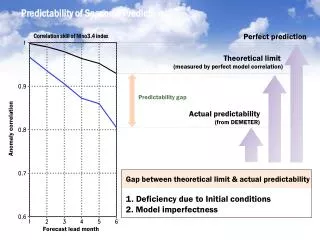
Is predictability constant in time? All slowly varying modes are characterised by some kind of typical evolution and are often time locked with the seasonal cycle. At some part of their life they are very predictable, at others not. It is often mentioned a predictability wall: • El Nino boreal spring • Indian monsoon boreal autumn…..
Exercise: predictability of precipitation in Oman • Evaluate probability of occurrence of an extreme tercile of precipitation during El Nino/La Nina events in a selected season • Check skill scores of precipitation seasonal predictions Repeat for different seasons. A strong relation between local climate and circulation indices may not always lead to predictability!
Influence of El Nino on Precipitation over MED 1950-2002 monthly gridded (0.5° lat/lon resolution) precipitation totals for global land areas University of East Anglia (UEA) Climatic Research Unit (CRU) TS2.1 dataset From the IRI portal….. Mason, S.J. and L. Goddard, 2001. Probabilistic precipitation anomalies associated with ENSO. Bulletin of the American Meteorological Society, 82, 619-638.
Brier Skill Score (Above Normal): Lead 1.5 months, Precipitation Forecast Skill: MAM
Brier Skill Score (Above Normal): Lead 1.5 months, Precipitation Forecast Skill: SON
Difference between parameter Different surface parameter may have completely different predictability, both in time and space. This is due to the fact that their predictability may be due to different reasons.
Brier Skill Score (Above Normal): Lead 1.5 months, T2m Forecast Skill: ALL
T2m - individual seasons JJA forecast 1.5m lead DJF forecast 1.5m lead
ENSO – basics about the ocean Depth of thermocline depends on • surface winds (mixing) • insolation (increasing surface temperature buoyancy) • Salinity of surface water ( buoyancy)
Climate impacts of El Niño events Typical El Niño impacts: December through February Typical El Niño impacts: Junethrough August
Climate impacts of La Niña events Typical La Niña impacts: DecemberthroughFebruary Typical La Niña impacts: Junethrough August
Connection between ENSO and All India rainfall The colors of the bars give the strength of ENSO during October-January for that year: red is a warm (El Niño) event, blue is a cold (La Niña) event. http://iridl.ldeo.columbia.edu/maproom/ENSO/Climate_Impacts/India_Rainfall.html
ENSO time variability Barnston and Tippet, 2014: Skill of Real-Time Seasonal ENSO Model Predictions during 2002–11: Is Our Capability Increasing?Bull. Amer. Meteor. Soc., 93, 631–651.
ACC dependence on model/lead time Temporal correlation between model forecasts and observations for all seasons combined, as a function of lead time. All seasons results. The eight statistical models and the persistence model are shown with dashed lines and the cross symbol.
ACC dependence on model/lead time Same figure but for two different time of the year: boreal winter and boreal summer
Time dependence of skills 3 months lead time (thick lines) and 6 months lead time(thin lines)
Modes of large-scale variability • El-Niño Southern Oscillation (ENSO) • Interannual variability of Indian Monsoon system: Quasi Biennial Oscillation and Indian Ocean Dipole • Intra-seasonal variability: Madden Julian Oscillation
Monsoons mechanisms • The seasonal oscillation of solar heating with net heating in the summer hemisphere, which leads to migration of the equatorial trough and the tropical convergence zones • The differential heating between the land and ocean and the resulting pressure gradient (Halley 1686) • The swirl introduced to the winds by the rotation of the Earth (Coriolis component, Hadley 1735) • Moisture processes and convection
Relation of ENSO on All India rainfall index The colors of the bars give the strength of ENSO during October-January for that year: red is a warm (El Niño) event, blue is a cold (La Niña) event. http://iridl.ldeo.columbia.edu/maproom/ENSO/Climate_Impacts/India_Rainfall.html
Interannual variability of Indian Monsoon Tropical Biennial Oscillation & Indian Ocean Dipole are two aspects of the same phenomenon, a bit like El Nino and the Southern Oscillation. First observed and described by Meehl. Meehl, G. A., 1994: Influence of the land surface in the Asian summer monsoon: external conditions versus internal feedbacks. J. Climate, 7, 1033-1049. Meehl, G., J. Arblaster, 2002: The tropospheric biennial oscillation and Asian-Australian monsoon rainfall. J. Climate, 15, 722-744. Meehl, G., J. Arblaster, and J. Loschnigg, 2003: Coupled ocean-atmosphere dynamical processes in the tropical Indian and Pacific oceans and the TBO. J. Climate, 16, 2138-2158.
Tropical Biennial Oscillation • This mode represents a connection between Indian and South Asian Monsoon. • It is a typical variability of the Asian Monsoon system, independent from ENSO, although ENSO has a strong influence. • It is a 2-3 years period