Download
1 / 31
310 likes | 478 Views
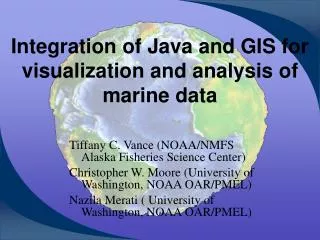
Integration of Living Marine Resource and Oceanographic Satellite Data. Dave Foley Joint Institute for Marine and Atmospheric Research University of Hawai’i at Manoa And Environmental Research Division Southwest Fisheries Science Center NOAA Fisheries Yi Chao and Ben Holt

E N D
Integration of Living Marine Resource and Oceanographic Satellite Data Dave Foley Joint Institute for Marine and Atmospheric Research University of Hawai’i at Manoa And Environmental Research Division Southwest Fisheries Science Center NOAA Fisheries Yi Chao and Ben Holt Oceanography Group NASA Jet Propulsion Laboratory California Institute of Technology
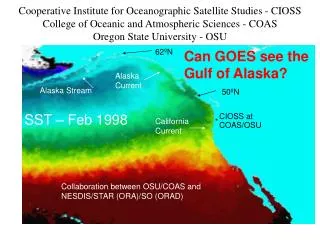
Include those from satellite sensors that measure SST Ocean color Ocean winds, and Sea surface height. Satellite Ocean Data and Data Products
Helping Others to Help Themselves • Digital data must be made available at Regional Level • WHO? • IOOS RA’s • National Backbone (CoastWatch, NASA DAACS). • HOW? • Live Access Servers • OpenDAP • Other as designated by IOOS DMAC • Tools to apply the data • Technical workshops to provide “hands-on” training • Projects to spearhead development
Regional Data Distribution • Near Real Time • Live access servers oceanwatch.pfel.noaa.gov/ • NEREIDS (nereids.jpl.nasa.gov) - CIMT Wind page (cimt.jpl.nasa.gov) • New and improved CoastWatch browser coastwatch.pfel.noaa.gov/coastwatch/CWBrowser.jsp • Delayed science-quality data • Live access servers (above) • POET (poet.jpl.nasa.gov) • Archive – PODAAC (podaac.jpl.nasa.gov)
Combining Ocean Obs and Sightings – (see Forney et al. in Posters session)
Modeling Cetacean Distribution Redux(Becker et al., in progress) • Easily acquired in GIS-ready format • Adequately resolves key features of CCS
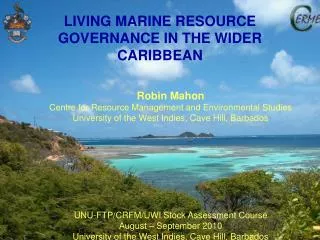
Predator and Prey Sightings with Satellite Data – (Benson and Forney)
Product Development Model • Target specific applications • Form partnerships with regional experts • Identify and acquire necessary data • Deliver and test experimental products • Transfer technology to National level • Adapt for application as appropriate elsewhere
JPL SAR Wind Speed Data Archive - So. California •RADARSAT SAR wind speed maps generated and archived for 2002 off California. Algorithm developed by JHUAPL for NOAA. Products operationally in use by NWS in Alaska. •Algorithm uses NOGAPS model wind direction to correct for variation of backscatter in relation to wind direction and antenna angle. Recently added MM5. •Developed interface with individual frames selectable and viewable by interactive mouse selection (left). •Enhancements: Add land mask, mosaic frames into strip. •Next: Add wide swath data from 2 satellites for 2005, suitable for evaluation for model wind forcing, Central CA. Original Product Enhancements Added land mask Mosaicked frames Location map and wind speed without mask.
Combination of HF RADAR CURRENTS with OCEAN COLOR satellite data 2/5/03 Combination of HF RADAR CURRENTS with OCEAN COLOR satellite data 2/5/03 Combination of HF RADAR CURRENTS with OCEAN COLOR satellite data 2/5/03
Development of high-resolution turbidity products from 250m resolution channels onboard MODIS satellites. Dr.’s M.Kahru and G. Mitchell Development of high-resolution turbidity products from 250m resolution channels onboard MODIS satellites. Dr.’s M.Kahru and G. Mitchell Santa Barbara Channel, Terra-MODIS pass of January 12, 2005; extensive sediment plume from the Santa Clara river: Santa Barbara Channel, Terra-MODIS pass of January 12, 2005; extensive sediment plume from the Santa Clara river:
Application I: Refining Definitions of Chinook Salmon Habitat • George Boehlert, George Watters and Cara Wilson (SWFSC) • Cindy Bessey, Jefferson Hinke, and Melissa Snover (JIMAR) • Over 100 TDR tags deployed at sea and recovered (Monterey Bay to Ft. Bragg, CA). • Published as Hinke et al., 2004 MEPS and Hinke et al., in press MEPS.
Application II: Olive Ridley Turtles • Yonat Swimmer, Lianne McNaughton and others (PIFSC). • Anders Nielson and John Sibert (PFRP). • Mike Laurs (JIMAR)
Looking forward • Piecemeal approach to physics ineffective – ultimate integration tool is the data assimilating model (next talk) • Similarly, examination of individual pieces of ecosystem will probably not describe well the ecosystem as a whole (following talks) • VERY IMPORTANT! The Satellite data requests you make today will determine the data available in 10-20 years.
Contact Information Dave Foley NOAA SWFSC - ERD 1352 Lighthouse Ave Pacific Grove, CA 93950 831.648.0632 dave.foley@noaa.gov http://coastwatch.pfel.noaa.gov/