Download
1 / 16
160 likes | 272 Views
Explore US historical involvement in Central America, impact of CAFTA, FTA negotiations, and regional economic integration relevance for Asia, focusing on trade liberalization. Assess Asia's perspective on US-CAFTA relations.

E N D
The US FTA with Central America and the Dominican Republic (DR-CAFTA): What Relevance for Asia? Carl A. Cira, J.D. Director, Summit of the Americas CenterLatin American and Caribbean CenterFlorida International UniversityMiami, Florida~~~~~~~~~~~~~~~~~APEC OFFICIAL SYMPOSIUM:IMPACT OF REGIONAL ECONOMIC INTEGRATION IN EAST ASIA ON APEC TRADE LIBERALIZATIONTokyo, 27-28 September 2006 SUMMIT OF THE AMERICAS CENTER, FIU.
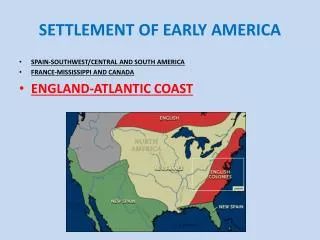
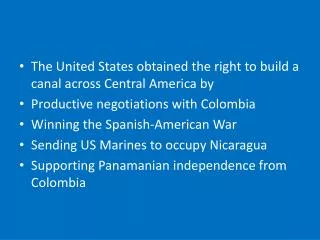
US and Central America –Recent History • 25 years of US focus on CA – often intense • 1980’s - leftist insurgencies and military governments ending - Peace Accords - Nicaragua, El Salvador, Guatemala, Honduras – Extensive US military and economic development assistance. • 1984 – Caribbean Basin Initiative (CBI) - UnilateralUS trade preferences to CA and Caribbean to promote economic growth, political stability and democratic development. - (By 2003, 77% of CA exports to US were duty free) • 1990’s - democratic elections, gradual economic recovery. Maquila (assembly) industries and non-traditional agriculture expanded steadily. • All 6 CAFTA countries now have over 50% of their two way commerce with the United States. SUMMIT OF THE AMERICAS CENTER, FIU.
Western Hemisphere Trade Negotiations -1990’s • 1994 - European Union and Mercosur begin FTA talks. • 1994 – Summit of the Americas – Miami – 34 leaders agreed to talks for a Free Trade Area of the Americas (FTAA). • 1995 – GATT Uruguay Round ends – World Trade Organization (WTO) begins • 1995 – NAFTA takes effect (US, Mexico, Canada) – CBI benefits diluted, CA trade + investment diverted to Mexico. CA begins to lobby US for “NAFTA parity.” • 1998 – FTAA negotiations formally begin. SUMMIT OF THE AMERICAS CENTER, FIU.
Free Trade Area of the Americas Negotiations 1998 - 2003 • 1998-2003 – FTAA ambition was a hemisphere–wide “WTO – plus” agreement by January 2005. Hundreds of working group and committee meetings held. Eight Trade Ministerial meetings and Four Summits. • “Single Undertaking” - No partial agreements. Nothing agreed until all is agreed. Nine Chapters and nine negotiating groups. Very broad consensus needed. • New disciplines: Services, Gov. procurement, investment protections, competition policy, trade facilitation, and “TRIPS – plus” for IPR. (Resistance on most of these.) • Reduction of US agricultural subsidies – focus of Brazil, Argentina etc. US unwilling outside WTO Doha context. • (Publication of Bracketed Draft Negotiating Text – July 2001. First time ever to blunt “secret negotiation” criticisms.) SUMMIT OF THE AMERICAS CENTER, FIU.
“PLAN B” – 2001 to date • Before 2000 – US preferred multilateral trade pacts – GATT/WTO. – only 3 bilateral US FTA’s - Canada, Mexico (NAFTA), and Israel. Jordan signed in 2000 absent Fast Track - Congress ratified 2001 • 2000 – Failure of Seattle WTO Ministerial; FTAA stalled, no Fast Track, Clinton administration opened FTA talks with Singapore and CHILE. • Chile and US had BIT and Chile had sought to join NAFTA since ‘92. Even so, 3 years of negotiations. • July 2002 - US TPA law (a.k.a., “Fast Track”) passed and Congress got back into the FTA game. • July 2003 - US – Chile FTA signed and ratified under new TPA. Effective January 2004. SUMMIT OF THE AMERICAS CENTER, FIU.
Why start with Chile? • Chile’s “Open Regionalism”- fastest, broadest liberalization of any Latin American nation in ’90s. • Chile FTA’s with 2/3 of NAFTA. [CANADA (1997) and MEXICO (1998)] • FTA with Costa Rica + Central America (2001) • In 2002, Chile signs Association Agreement (FTA) with European Union - (commercial, political pacts plus technical and cultural cooperation) • Chile an Associate MERCOSUR member since ‘96, but Chile-EU negotiated apart from MERCOSUR-EU talks, also stalled in 2002 (and to date…..) • Strategically, a US FTA with Chile easiest to overcome US Congressional ratification hurdles. • Solid trade partner, stable market economy, dynamic trade leadership in Latin America. • (And no illegal immigration problems………...) SUMMIT OF THE AMERICAS CENTER, FIU.
Why Central America Next in US Line? • 2001- FTA’sChile - Costa Rica + Central America • April 2001 - Costa Rica – Canada FTA. July 2001 Costa Rica president gives Bush draft proposal for a US - Costa Rica or US - Central America FTA. • Latin American leaders rush to join US bilateral queue…. • After 2002 TPA passage, USTR pressured heavily for FTAA progress and delayed on more bilaterals, moving only on Chile. • USTR used the implicit openness to other eventual bilaterals to try to move FTAA ahead. Ultimately unsuccessful……… • Brazil - main resisting counterpart. Other policy imperatives, regional leadership ambitions, limited dependence on US trade. • Early 2003: Clear that FTAA not moving. USTR accelerated “Plan B” - “multiple bilaterals,” opening “discussions” with Central America as next priority after completing Chile. • End 2003: FTAA stalls – “Single Undertaking” abandoned – Two tier structure decided, but February 2004 Vice Ministers meeting unable to progress. Moribund since then. SUMMIT OF THE AMERICAS CENTER, FIU.
Brazil and Mercosur – “China Ex Machina”? • Brazil “Plan B” – After FTAA stall, pushed revival of EU-Mercosur FTA. Still not moving today. EU has other internal priorities. EU Agriculture - main obstacle. • MERCOSUR crisis - Argentina collapse further slowed integration; Uruguay and Paraguay seek US FTA’s; New member Venezuela mainly political – minimal trade. • South American Community? – non-substantive. • MERCOSUR–Andean Community FTA – hollow so far. • 2004 - China to the Rescue! China factor in LA highlighted by Presidential visits. Huge China S.A. commodity sales boost Brazil, Argentina, Chile, and Peru. (agricultural, mining, petroleum) Investments? • Andes and Central America. Rest of region benefiting less - low priced China manufactured imports in home markets + strong competition for US import market. SUMMIT OF THE AMERICAS CENTER, FIU.
DR-CAFTA Trade with US (2004)+/- $35 bn (1.5% of US trade) • Guatemala - Ex: $ 3.1 (48%) Im: $ 2.5(32%) • Honduras - Ex: $ 1.7 (54%) Im: $ 4.1 (37%)* • El Salvador - Ex: $ 2.0 (60%) Im: $ 1.9 (32%) • Costa Rica - Ex: $ 3.3 (53%) Im: $ 3.3 (42%) • Dom. Rep. - Ex: $ 4.5 (78%) Im: $ 4.3 (54%) • Nicaragua - Ex: $ 0.9 (82%) Im: $ 0.59 (52%) • Together the DR-CAFTA countries are the Second Largest U.S. Latin American trading partner after Mexico. SUMMIT OF THE AMERICAS CENTER, FIU.
More Factors on Relative Importance of Central American Market for U.S. ~ DR - CAFTA Market Significance: • Total U.S. exports - $15 bn. (2003) Equals combined US exports to Russia, India, and Indonesia. 12th largest U.S. export market • Agricultural exports - $1.3 bn.US exports account for largest share of Central American agricultural imports. • 13,000 US small and medium businesses export to Central America+DR –37% of total U.S. merchandise exports to region. ~ Current Regional Barriers to U.S. Trade: • Average WTO bound rate 45% - Some key U.S. exports face WTO bound rates of 250% • Non-tariff trade barriers - Price bands, discretionary import licenses, and absorption agreements ~ DR - CAFTA Tariff Reduction and Elimination: • All products go to zero – 15 year maximum • Linear cuts - from applied rates, not bound rates • Phases - Immediate, 5, 10, 12/15 years • Backloaded cuts - certain sensitive products SUMMIT OF THE AMERICAS CENTER, FIU.
Costa Rica Honduras Guatemala Nicaragua El Salvador Dominican Republic Exports - US 29.8%, Netherlands 14.2%, UK 8.4%, China 7.6% Imports - US 43.4%,Japan 5.8%, Mexico 5.3%, Venezuela 4.9%, Brazil 4.4% Exports - US 74.4%, Guatemala 3%, El Salvador 2.9% Imports - US 53.7%, Guatemala 6.5%, El Salvador 4.2% Exports - US 50.1%, El Salvador 12.1%, Honduras 7.3%, Mexico 4% Imports - US 38.1%, Mexico 7.6%, El Salvador 4.8%, S. Korea 4.8%, Panama 4.4% Exports - US 64.1%, El Salvador 6.6%, Mexico 3.4% Imports - US 20.6%, Venezuela 10%, Costa Rica 8.5%, Guatemala 7.1%, Mexico 5.7%, El Salvador 4.8%, South Korea 4.3% Exports - US 61%, Guatemala 12.1%, Honduras 7.4%, Nicaragua 4.2% Imports - US 43.4%, Guatemala 8.2%, Mexico 7.8% Exports - US 79.9%, Netherlands 2.4%, Canada 1.8% Imports - US 51%, Colombia 5.4%, Mexico 5.3% [Source – CIA Factbook 2005] DR-CAFTA Main 2005 Trade Partners SUMMIT OF THE AMERICAS CENTER, FIU.
The US Ratification Struggle • US did not submit agreement to Congress after signing for one year until 2005 (2004 election year, etc.) • Opposition on labor issues and perceived textile industry state business and job losses, and “big sugar” concern over increased access to US sugar market (110,000 mt) • China textile competition had exploded after January 2005, with immediate negative impacts on US+Central American industries. Relief sought + received. • Up to $4 bn. in US manufactured exports to CA+DR jeopardized if CAFTA nations lose textile industries • Very close vote in lower house (217-215) SUMMIT OF THE AMERICAS CENTER, FIU.
Current DR - CAFTA Status • Costa Rica has not ratified yet. (was CA’s lead CAFTA negotiator). • Dominican Republic - unresolved issues – USTR not yet satisfied with DR legislative and administrative compliance. • Fully effective for Nicaragua (3/06), El Salvador (3/06), Honduras (3/06), and Guatemala (6/06). (US removes signatory country from GSP, CBI, and CBTPA benefits on date DR-CAFTA enters into force for that country). • Former Unilateral US Preferencesnow converted into permanent and reciprocal benefits and obligations. • Textiles in limbo - CAFTA pushed as response to expected Chinese textile deluge. Incentives to regional industries using US cloth, yarn, and thread and “cumulation.” US ratification delay and slow CA + DR compliance with US requirements have blunted effects and delayed investments. SUMMIT OF THE AMERICAS CENTER, FIU.
Gains for Asian Trade? • Improved investment opportunities for direct access to US market via CA + DR • Investment opportunities for indirect US duty free access (Mexico – Japan FTA - Mexico mfrs = qualified inputs for DR-CAFTA Origin cumulation) • Some uncertainty over CBTPA investments in Costa Rica if CR ratification is delayed into 2007 SUMMIT OF THE AMERICAS CENTER, FIU.
DR- CAFTA -Summing Up • Consolidationof US trade relations in CA + DR • Building block for potential revival of FTAA • Potential effective regional integration of US and NAFTA-DR-CAFTA textile industries • Implementation lab for TRIPS–plus IPR, other “Singapore issues.” Piracy criminalized • New and strengthened regional dispute settlement mechanism (SIECA) • New and stronger mutual obligations among all 7 signatory countries • Clear benefits for Central American integration SUMMIT OF THE AMERICAS CENTER, FIU.
Thank you for your attention….www.AmericasNet.net SUMMIT OF THE AMERICAS CENTER, FIU.