Download
1 / 10
100 likes | 263 Views
A Comparison of Congo and Amazon Wetland Hydraulics from Repeat-Pass Interferometric SAR Measurements. Hahn Chul Jung and Doug Alsdorf The Ohio State University June 26, 2008.

E N D
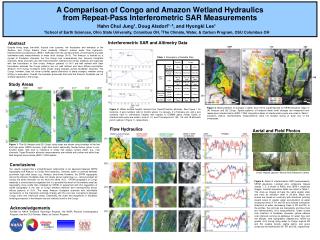
A Comparison of Congo and Amazon Wetland Hydraulics from Repeat-Pass Interferometric SAR Measurements Hahn Chul Jung and Doug Alsdorf The Ohio State University June 26, 2008
Figure 1. Study locations of (A) Amazon and (B) Congo. Overlay of dual-season composite JERS-1 SAR GRFM mosaic. Ground gauge station marked with a1 dot in Amazon and altimetric measurements marked with c1 and c2 dots are used to complement interferometric SAR measurements. White lines indicate Topex/POSEIDON orbits. Red diagonal boxes locate JERS-1 SAR swaths.
Figure 2. Water surface heights, relative to a common datum, derived from ground-based gauge station in a1 (courtesy of ANEEL, station ID: 12351000) and radar altimetric results in c1 and c2 (courtesy of GOHS/LEGOS, zone 083_1 and 172_5).
Table 1. The description of study area and data used in this study.
Vegetation Maps(Arc shape files) 1:2,000,000 8 classes 1:5,000,000 38 classes http://www.geog.umd.edu/carpe/gisthemes.html
Vegetation Maps (merging, gridding, projection, etc.) Edaphic forest (D.R. Congo) ********* Flooded forest (Congo) Equatorial, semi-deciduous, and littoral forest Floating prairie Savanna
Interferometric SAR Measurement Figure 3. Measurements and estimates of water level change (dh/dt) were superimposed on SRTM elevation maps in Amazon (left) and Congo (right). Spatial patterns of temporal water level changes are measured from repeat-pass interferometric SAR.
Flow hydraulic Interpretation Figure 4. The details of flow hydraulic interpretation in Figure 3. White lines indicate the profiles of water level change (dh/dt) and SRTM DEM elevation. Red and blue flow arrows are based on continuity with directions pointing toward areas of greater and smaller water accumulation at increasing and decreasing water times, respectively.
Figure 4. Continued Veg. Types (1:2,000,000) Flooded forest Equatorial, semi-deciduous, and littoral forest Floating prairie
Figure 4. Continued Veg. Types *Edaphic: Resulting from or influenced by the soil rather than the climate (Merriam-Webster) *Edaphic forest (D.R. Congo) ********* Flooded forest (Congo) Floating prairie (1:5,000,000) (1:2,000,000)