Download
1 / 37
370 likes | 487 Views
The State of the Safety Net in the Post-Welfare Reform Era. Marianne Bitler (UC Irvine) Hilary W. Hoynes (UC Davis) Paper prepared for Brookings Papers on Economic Activity , Sept 2010. Motivation and Overview.

E N D
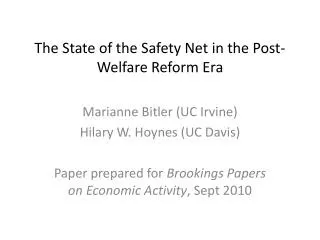
The State of the Safety Net in the Post-Welfare Reform Era Marianne Bitler (UC Irvine) Hilary W. Hoynes (UC Davis) Paper prepared for Brookings Papers on Economic Activity, Sept 2010
Motivation and Overview • Sweeping changes to the U.S. safety net took place in 1996: Federal welfare reform ended the entitlement to cash welfare for eligible poor families with children • Many studies have evaluated the impact of this important reform on family and child well-being • Here we re-examine the impact of welfare reform in light of the current great recession • We ask whether the effects of this recession, in the post-welfare reform era, are any different than they would have been in the absence of reform • With welfare providing “less protection,” is the recession causing more harm?
Our study • Given our interest in welfare reform, we focus on families with children and the nonelderly • We examine a wide range of outcomes: • Participation in cash welfare and the safety net more broadly, employment and official poverty • Because of limitations in the official poverty measure, we also look at alternative poverty measures, housing stress, food insecurity, food consumption, health insurance coverage, and health • Where possible, we also rely on administrative data given concerns about underreporting in the Current Population Survey • Where possible, we compare outcomes in the current recession to those of the 1981/1982 recession • Caveat: some outcomes are only available through 2008
Plan for the talk • What is welfare reform? • What do we know from prior work on the impacts of welfare reform? • Descriptive evidence: Cycles and the disadvantaged pre- and post-welfare reform • Estimates of the impact of welfare reform on the well-being of the disadvantaged across cycles
What was welfare/what is it now? • Old system: Aid to Families with Dependent Children (AFDC) • Entitlement, income and asset tested, targeted to single-parent families • Tremendous variation by state in generosity • High implicit tax rates on earnings, significant work disincentive • Costs shared by states/federal government • Now: Temporary Assistance to Needy Families (TANF) – replaced AFDC • AFDC’s disincentives for work/formation of two-parent families led (in large part) to the 1996 reform • Sticks: Lifetime time limits (max of 5 years), work requirements, financial sanctions • Carrots: Some states reduced implicit tax rates • Entitlement gone, funded by block grants to states • Some states reformed their programs prior to 1996 law through waivers • In our empirical work, we take advantage of the significant state variation in the timing of welfare reform and the severity of the policy changes
Impacts of welfare reform: Prior Literature • Reduced the number of families receiving cash aid • Increased employment of disadvantaged single mothers • Little consistent evidence that poverty increased (or decreased) • Little consistent evidence that child well-being worsened (or improved) • Reform took place when the labor market was very strong (late 1990s) and EITC was expanded; these factors softened impact of reform • What we do: How has welfare reform changed the relationship between economic cycles and family well-being?
The U.S. Social Safety Net for Families • TANF: cash welfare • Food Stamps (now SNAP): vouchers for food • Earned Income Tax Credit: tax-subsidy for low earners • Medicaid: health insurance • Subsidized housing • WIC, free or reduced price lunch • Unemployment insurance (not limited to low income families)
Welfare reform took place as part of large changes in the safety net
Figure 6: Annual employment for women 20-58 Beginning in 1992—dramatic increases in employment for single mothers, with little change for other women
Figure 8: Other elements of the safety net appear to be more cyclical than AFDC/TANF
Cycles and welfare reform: New evidence • Recessions lead to reductions in earnings and income, and worsening of family well-being • Previous work shows that the impact of cycles is larger (in magnitude) for low-skilled individuals • We investigate whether welfare reform has changed how the current contraction is affecting disadvantaged families • We start with descriptive comparisons of outcomes across cycles, pre- and post-reform • We then use variation across states in the timing and severity of the cycles and welfare reform
Data • March Current Population Survey 1979-2009 • Poverty, Alternative NAS Poverty, Earnings, Income • Family structure, housing stress, health • Participation in safety net programs • Administrative Data: AFDC/TANF, Food Stamps, UI • Caseloads and total expenditures • Food insecurity, from CPS food security supplements • Unemployment rates from the labor department
Figure 1 • Official poverty: compare total pre-tax family cash income to poverty thresholds (which vary by family size and year) no food stamps and no EITC • Alternative Poverty: includes noncash benefits, the EITC, and taxes [striking how much less it has increased in this recession]
Fig 2: Poverty typically rises and falls across the business cycle
Descriptive evidence on the impact of this contraction compared to that of the early 1980s
Descriptive evidence on the impact of this contraction compared to that of the early 1980s
Figure 3: TANF caseloads are responding less to this recession compared to Food Stamps
Figure 3: TANF caseloads are responding less to this recession compared to Food Stamps
Figure 4: Compared to the 1980s recession, incomes of the poor in this recession show less cash welfare and more earnings and Food Stamps Note: Data for this figure only available through 2008. Share of income by source Share of income by source Families with Income < poverty Families with Income < 50% poverty
Summary of descriptive evidence: • Use of the non-cash welfare safety net, poverty, food insecurity, and health care access show strong countercyclical trends • Limitation of the this approach: • Difficult to distinguish effects of the policy change (e.g., welfare reform) from other factors affecting outcomes • Example: Cash assistance payments fell during the early 1980s recession. Prior work has shown that this is due to the increase in benefit reduction rates in 1981 which reduced eligibility.
Core empirical model: Welfare reform and well-being across cycles • We use variation across states and over time in unemployment (UR) and in the timing and severity of welfare reform (REFORM) • We are interested in the coefficient on the interaction of unemployment and reform • We use variation from waivers and TANF • Regressions run on administrative data (state per capita caseloads) and CPS micro-data (where we also include controls for demographics) • Cluster standard errors on state
2007-2009: (a) TANF, (b) Food Stamps, (c) Child Poverty Figure 9: Graphical view of regression approach 1979-1982: (a) AFDC, (b) Food Stamps, (c) Child Poverty
2007-2009 Observation 1: Little relationship between changes in state labor market conditions and TANF. Different from earlier recession. 1979-1982
2007-2009: (a) TANF, (b) Food Stamps Observation 2: Food stamps shows stronger connection to labor market changes. More than earlier period and more than TANF. 1979-1982: (a) AFDC, (b) Food Stamps
2007-2009: (a) TANF, (b) Food Stamps, (c) Child Poverty Observation 3: No obvious changes in the relationship between labor market fluctuations and child poverty 1979-1982: (a) AFDC, (b) Food Stamps, (c) Child Poverty
Measures of Welfare Reform • Pre-Post, any reform = 1 if state has a waiver or TANF • Severity of time limits (for waivers or TANF) • No time limit • Adult time limit (children are still covered after hit TL) • Long time limit (>=48 months) • Short time limit (<48 months) • Severity of financial sanctions (for waivers or TANF) • Weak or no sanctions • Gradual sanctions • Full sanctions
Both AFDC/TANF and food stamps are countercyclical • Welfare reform is generally associated with reductions in the cyclicality of AFDC/TANF and increases in the cyclicality of food stamps • Work by others shows that the reduction in welfare caseloads is coming from decreases in take-up—84% in 1994 vs. 40% in 2005 (rather than decreases in eligibility)
AFDC/TANF income is countercyclical, earnings and income are procyclical • Interactions of UR and reform show that cyclicality of earnings and income has increased, and countercyclical nature of AFDC/TANF has decreased. safety net providing less insurance
Official poverty is more cyclical post-reform; also true for alternative poverty (including noncash transfers and EITC, subtracting taxes) • Few statistically significant results
Results for AFDC/TANF and Food stamps are similar to the administrative data (maybe measurement error in the CPS is not such a problem) • SSI not related to the cycle • Overall safety-net participation is strongly countercyclical and has become more so with welfare reform
All the interactions are positive more cyclicality post-reform. But no statistically significant results. • We found no impact on health status, food insecurity (CPS FSS), and food consumption (PSID)
Summary of results • Administrative Data (per capita caseloads/$) • AFDC/TANF and Food Stamps are countercyclical • Welfare reform reduced the cyclicality of AFDC/TANF but increased the cyclicality of Food Stamps • GAO/UI TRIM Model: Caseload reductions post-reform mostly reductions in take-up, not eligibility • Survey Data • Findings about cyclicality of AFDC/TANF and Food Stamps consistent with administrative data • Increases in the cyclicality of single women’s earnings and income • Official poverty, alternative poverty (+ transfers, - taxes, + tax credits), and broad safety net use are more cyclical after reform • No effects on doubling up/health insurance coverage/self-rated health/food consumption (PSID)/food insecurity (CPS FSS)
Conclusions • We examine how the cyclicality of the safety net and family well-being has changed post-welfare reform • Non-welfare safety net participation has become significantly more responsive to cycles post-welfare reform • The earnings and income of single headed households have also become more cyclical post-reform. Poverty may have become more cyclical, but results are imprecise. • We find no significant effects for food consumption, food insecurity, health insurance, household crowding, or health • Concerns remain about the growing share of children in families that are “disconnected”— with little visible means of support from earnings or government assistance • We will know more as the data becomes available for 2010