Download
1 / 8
90 likes | 218 Views
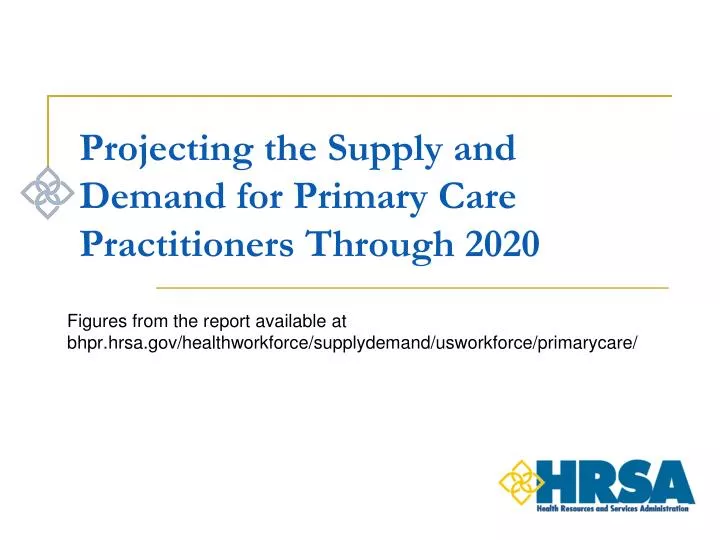
Projecting the Supply and Demand for Primary Care Practitioners Through 2020. Figures from the report available at b hpr.hrsa.gov/ healthworkforce / supplydemand / usworkforce / primarycare /. Exhibit 2. Physician Age Distribution at Completion of Medical School, 2009.

E N D
Projecting the Supply and Demand for Primary Care Practitioners Through 2020 Figures from the report available atbhpr.hrsa.gov/healthworkforce/supplydemand/usworkforce/primarycare/
Exhibit 2. Physician Age Distribution at Completion of Medical School, 2009 Data Source: AAMC Medical School Graduation Questionnaire: 2013 All Schools Summary Report.
Exhibit 3. Average Patient Care Hours Worked per Week: General Internal Medicine Data Sources: Analysis of HRSA 2002-2003 Survey and AAMC 2006 Survey of Physicians Over Age 50.
Exhibit 4. Annual Number of Graduates From NP Programs: Master’s and Post-Master’s Graduates, 2002 Through 2012 Data Source: HRSA compilation of data from the AACN Annual Survey (in collaboration with the National Organization of Nurse Practitioner Faculties for collection of nurse practitioner data). Note: Counts include master’s and post-master’s degree NP and NP/clinical nurse specialist graduates as well as bachelor’s-to-doctorate of nursing practice graduates.
Exhibit 5. Annual Number of Newly Certified PAs, 2001 Through 2012 Data Source: National Commission on Certification of Physician Assistants (NCCPA), “Certified Physician Assistant Population Trends”; 2012 data from personal communication with NCCPA, January 16, 2013.
Exhibit 6. Estimated Use of PCPs (FTEs) per 100,000 Persons Within Each Age Group, 2010 Data Source: Analysis of the multiple sources of data outlined in this report on patient utilization by setting (e.g., the NAMCS, NHAMCS, and NIS) and those on physician time allocation across settings of care.
Exhibit 7. Projected Demand for Primary Care Physicians a National demand projections presented in this report assume that in 2010 the national supply of primary care physicians was adequate except for the approximately 7,500 FTEs needed to de-designate the primary care HPSAs. bThis category includes general and family practice, and general internal medicine.
Exhibit 8. Projected Supply and Demand for Primary Care NPs and PAs *There were no data available for estimating if there were base year shortages of NPs and PAs. Note: Counts of NPs and PAs are not adjusted for productivity.