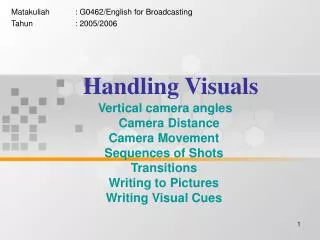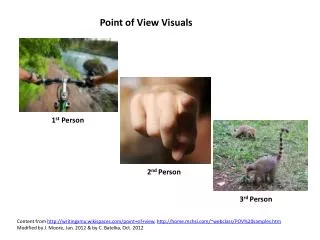
Typical Functions of Visuals
Typical Functions of Visuals. Emphasize Ideas .Display abstract ideas in concrete, geometric shapes .Condense .Dramatize .Compare large amount of data .Indicate trend .Convey reality .Show internal parts .Depict relationships. Using Visuals in Documents.

Typical Functions of Visuals
E N D
Presentation Transcript
Typical Functions of Visuals • Emphasize Ideas • .Display abstract ideas in concrete, geometric shapes • .Condense • .Dramatize • .Compare large amount of data • .Indicate trend • .Convey reality • .Show internal parts • .Depict relationships
Using Visuals in Documents • Analyze the context and choose appropriate type • Function of visual • Data • Reader and purpose • Medium • Facility
Using Visuals in Documents • Design the visual • Select appropriate scales. • Don’t clutter the visual. • Label parts neatly. • Make lettering readable. • Provide keys, legends. • Number visuals if there is more than one. • Title it. • Indicate sources. • Choose appropriate colors. • Consult an illustrator/graphic artist if there is one.
Using Visuals in Documents • Incorporate the visual in the text. • Placing it on a page • Close to the context • App. use of white space around • Not buried the visual in text • Aligned with text. • Referring to it • Interpreting it
Software Programs • Vector programs • Illustrator • Corel Draw • Visio • Raster programs • Photoshop • Graphic utilities • Screen-capture programs
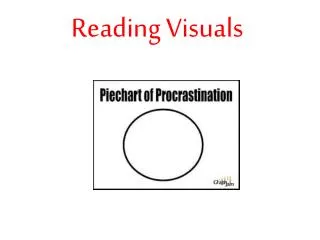
What Does a Good Visual Do? • Attracts attention and creates interest • .Provides information clearly, quickly • .Helps users comprehend information • .Helps users retain information
Edward Tuft • Create graphics to support readers’ mental task • .Identify design principles that help create such graphics • .Don’t decorate thin data or complicate complex data (avoid ”chartjunk”)
Tufte’s Works • The Cognitive Style of PowerPoint 2003 • .Visual Explanations: Images and Quantities, Evidence and Narrative 1997 • .Visual and Statistical Thinking: Displays of Evidence for Making Decisions 1997 • .Envisioning Information 1990 • .The Visual Display of Quantitative Information 1983