Download
1 / 16
160 likes | 289 Views
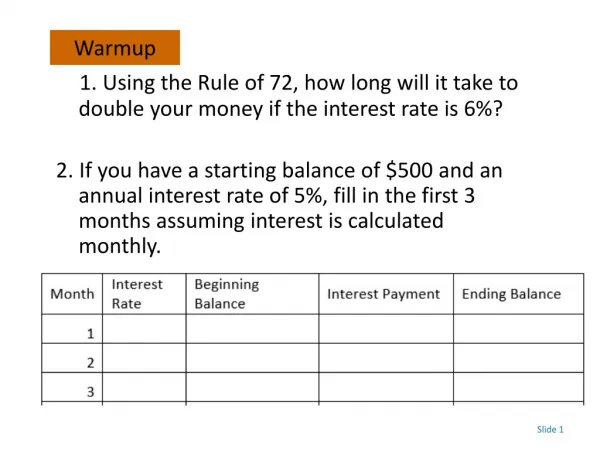
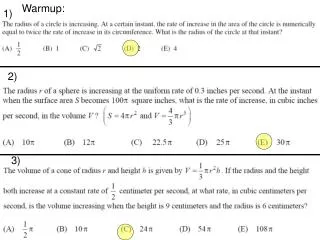
MIA U3D8 Warmup :. Every year on her birthday, Logan’s mom measured her height to see how much she had grown in the past year. The table above shows Logan’s height in inches between the ages of 5 and 14. 1. What is the average rate of change in her height between age 5 and age 8?

E N D
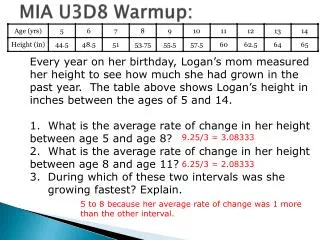
MIA U3D8 Warmup: Every year on her birthday, Logan’s mom measured her height to see how much she had grown in the past year. The table above shows Logan’s height in inches between the ages of 5 and 14. 1. What is the average rate of change in her height between age 5 and age 8? 2. What is the average rate of change in her height between age 8 and age 11? During which of these two intervals was she growing fastest? Explain. 9.25/3 = 3.08333 6.25/3 = 2.08333 5 to 8 because her average rate of change was 1 more than the other interval.
Homework Check: • Check using Document Camera • PSAT…10th graders only • Go directly to your testing site • Attendance will be taken. If you are late and not admitted, you MUST be in class as scheduled. • Take a pencil and a calculator • When dismissed report directly to class IF we are still in 3rd period
Transformations: Objective: To learn to - identify the effect on the graph of replacing f(x) by f(x + h) and f(x) + k. -find the value of h or k given the parent function and its transformation.
It is important to understand the relationship between a function and the graph of a function. We will explore how a function and its graph change when a constant value is added to the function. When a constant value is added to a function, the graph undergoes a vertical shift. A translation of a graph moves the graph either vertically, horizontally, or both, without changing its shape. A translation is sometimes called a slide. A translation is a specific type of transformation.
A vertical shift is a type of translation that moves the graph up or down depending on the value added to the function. (Add k to f(x)) A horizontalshift is a type of translation that moves the graph left or right depending on the value within the function. (Add h to x in f(x))
Key Concepts • Vertical translations can be performed on linear and exponential graphs using f(x) + k, where k is the value of the vertical shift. • A vertical shift moves the graph up or down k units. • If k is positive, the graph is translated up k units. • If k is negative, the graph is translated down k units. • Translations are one type of transformation. • Given the graphs of two functions that are vertical translations of each other, the value of the vertical shift, k, can be found by finding the distance between the y-intercepts.
Common Errors/Misconceptions • mistaking vertical shift for horizontal shift • mistaking a y-intercept for the value of the vertical translation • incorrectly graphing linear functions • incorrectly combining like terms when changing a function rule
Function Notation • Complete Investigations: Vertical and Horizontal Transformations of Functions: together
Assignment: CW: Vertical and Horizontal Translations of Functions CW WS HW: Vertical and Horizontal Translations of Functions HW WS TEST FRIDAY