Download
1 / 9
90 likes | 111 Views
This supplementary figure shows the analysis of OT-II T-cell responses in WT and Dectin-1 knockout mice during infection, including cell frequency, division index, transcription factors, and cell viability.

E N D
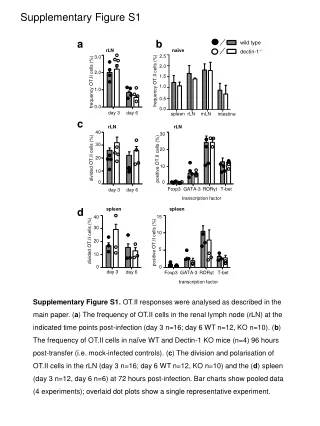
Supplementary Figure S1 wild type dectin-1-/- a b rLN naïve 3.0 2.5 2.0 2.0 1.5 frequency OT.II cells (%) frequency OT.II cells (%) 1.0 1.0 0.5 0.0 0.0 day 3 day 6 spleen rLN mLN intestine c rLN rLN 40 30 30 20 20 divided OT.II cells (%) positive OT.II cells (%) 10 10 0 0 Foxp3 GATA-3 RORγt T-bet day 3 day 6 transcription factor d spleen spleen 15 40 30 10 20 divided OT.II cells (%) positive OT.II cells (%) 5 10 0 0 day 3 day 6 Foxp3 GATA-3 RORγt T-bet transcription factor Supplementary Figure S1. OT.II responses were analysed as described in the main paper. (a) The frequency of OT.II cells in the renal lymph node (rLN) at the indicated time points post-infection (day 3 n=16; day 6 WT n=12, KO n=10). (b) The frequency of OT.II cells in naïve WT and Dectin-1 KO mice (n=4) 96 hours post-transfer (i.e. mock-infected controls). (c) The division and polarisation of OT.II cells in the rLN (day 3 n=16; day 6 WT n=12, KO n=10) and the (d) spleen (day 3 n=12, day 6 n=6) at 72 hours post-infection. Bar charts show pooled data (4 experiments); overlaid dot plots show a single representative experiment.
Supplementary Figure S2 * a b c mLN rLN spleen 1.4 1.4 1.4 division index 1.2 division index 1.2 division index 1.2 1.0 1.0 1.0 day 3 day 6 day 3 day 6 day 3 day 6 Supplementary Figure S2. Division of OT.II cells in the (a) mLN, (b) rLN and (c) spleen expressed as the division index (DI), where DI = (100-y)/y, and y = (x0 + x1)/2 + (x2/4) + (x3/8) + (x4/16) + (x>5/32). x0 represents the frequency of cells in the undivided peak, and x1-5 represent the frequency of cells in the subsequent division peaks. See reference 36 for a full explanation. Bar charts show pooled data (2-3 experiments); overlaid dot plots show a single representative experiment.
Supplementary Figure S3 * 15 10 % divided OT.II cells 5 0 WT DCs KO DCs Supplementary Figure S3. Division of OT.II cells stimulated in vitro with OVA-loaded CD11c+ cells purified from the mLN of either WT or Dectin-1 KO mice. Proliferation of the T-cells was determined by CFSE dilution after 72 hours of stimulation. Data pooled from two independent experiments.
Supplementary Figure S4 CD4+ T-cells CD8+ T-cells dectin-1-/- dectin-1-/- WT WT 3.37 4.79 5.92 5.56 7.21 6.89 7.24 5.48 naive 5.23 5.11 14.0 7.70 5.88 6.49 6.28 6.73 infected Annexin-V 7-AAD Supplementary Figure S4. Cell viability staining of CD4+ and CD8+ T-cells in the mLN at 72 hours post-infection in WT and Dectin-1 KO mice. T-cells in the mLN were labelled using standard flow cytometry methods (see experimental procedures) and subsequently labelled with fluorophore-conjugated Annexin-V and cell viability dye 7-ADD. Cells in early apoptosis were defined as Annexin-V+ 7-AAD- (top left gate). Necrotic cells were defined as Annexin-V+ 7-AAD+ (top right gate). Example plots are representative data obtained from 4 independent experiments (n=12).
Supplementary Figure S5 * * a b c d 15 20 20 15 15 15 10 10 apoptotic CD11b+ myeloid cells (%) apoptotic OT.II cells (%) 10 10 apoptotic dendrtiic cells (%) apoptotic B-cells (%) 5 5 5 5 0 0 0 0 wt ko wt ko wt ko wt ko Supplementary Figure S5. Frequency of apoptotic (a) OT.II cells, (b) B-cells, (c) dendritic cells (MHCII+ CD11c+) and (d) total CD11b+ (MHCII- CD11c-) cells in the mesenteric lymph nodes of WT (filled bars) and Dectin-1 KO (clear bars) at 72 hours post-infection. Data is representative of two independent experiments (n=3 per group).
Supplementary Figure S6 a WT Dectin-1-/- Dectin-2-/- naïve 12 infected 8 * * * * * * total number (x106) 4 0 40 30 20 frequency (%) 10 0 B-cells B-cells B-cells γδ T-cells γδ T-cells γδ T-cells CD4+ T-cells CD8+ T-cells CD4+ T-cells CD8+ T-cells CD4+ T-cells CD8+ T-cells b WT Dectin-1-/- Dectin-2-/- naïve 4 infected 3 2 total number (x106) 1 0 50 40 30 frequency (%) 20 10 0 B-cells B-cells B-cells γδ T-cells γδ T-cells γδ T-cells CD4+ T-cells CD8+ T-cells CD4+ T-cells CD8+ T-cells CD4+ T-cells CD8+ T-cells Supplemental Figure S6. Analysis of the lymphocyte compartment in the (a) mLN and (b) renal LN in naïve (light grey bars, n=6) and infected (dark grey bars, n=12) WT, Dectin-1 KO, and Dectin-2 KO animals. Cell populations were identified by flow cytometry and enumerated using Trypan blue counts. Data is pooled from 3 independent experiments.
Supplementary Figure S7 wild type dectin-2-/- a b 30 10 8 20 6 total no. cells (x106) no. peyer;s patches >1mm3 4 10 2 0 0 infected naive infected naive Supplemental Figure S7. WT and Dectin-2 KO mice were analysed as described for Dectin-1 KO mice for (a) the mLN cell number (left panel; infected: WT n=29, KO n=14, naïve: WT n=16, KO n=6) and (b) number of visible Peyer’s patches (right panel; infected: WT n=9, KO n=3, naïve: WT n=8, KO n=2) at 72 hours post-infection. Bar charts show pooled data from three experiments; overlaid dot plot shows a representative experiment.
Supplementary Figure S8 * * wt (C. tropicalis + DSS) a b ko (C. tropicalis + DSS) * control (C. tropicalis, no DSS) 9 20 8 15 7 colon length (cm) total cell number (x106) 10 6 5 5 4 0 control wt ko control wt ko Supplemental Figure S8. WT (filled bars, n=20) and Dectin-1 KO (clear bars, n=16) were maintained on C. tropicalis/DSS drinking water following antibiotic treatment (as outlined in Figure 6h) and analysed at day 5 post-DSS exposure. Animals were compared to a control group (striped bars, n=6) consisting of WT animals maintained on C. tropicalis drinking water (no DSS) for (a) colon length and (b) total number of cells isolated from the mLN. Data is pooled from 2 independent experiments.
Supplementary Figure S9 * * a b DCs pre-stimulated with LPS 2.0 15 1.5 10 frequency labelled DCs in mLN (%) total cell number (x106) 1.0 5 0.5 0 0 unlabelled DCs WT DCs + OVA KO DCs + OVA CMAC-labelled DCs Supplemental Figure S9. (a) CD11c+ cells were positively purified from naïve WT mLNs and labelled with 25 μM CellTracker Blue CMAC (Life Technologies) per manufacturers instructions. Labelled or unlabelled DCs were then transferred to WT recipient mice, as before. Mice were subsequently infected with Calb-Ag and the frequency of labelled DCs determined in the mLN at day 3 post-infection. (b) WT or Dectin-1 KO CD11c+ cells were purified from naïve mLNs and pre-stimulated in vitro with 5 ng/mL LPS and 5 μg/mL OVA for 18 hours. 5x10⁵ stimulated DCs were then transferred into Dectin-1 KO recipients (n=4 per group), which were subsequently infected with 2x10⁵ Calb-Ag. The total number of cells in the mLNs of infected recipient mice was analysed at day 3 post-infection. Data is representative of 2 independent experiments.