Download

1 / 32
320 likes | 468 Views
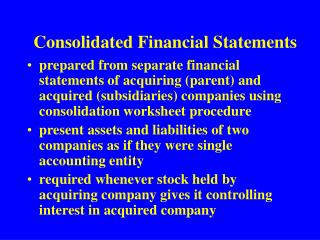
Consolidated financials include: DEI + DIH + DNI – Inter-company Interim consolidated numbers are internal figures and reviewed by CPA Consolidated numbers are audited only at yearend. 2003 Quarterly Results. Revenues. Unit: NT$ billion. Revenues by Product. 4Q02. 4Q03. Electro-

E N D
Consolidated financials include: DEI + DIH + DNI – Inter-company • Interim consolidated numbers are internal figures and reviewed by CPA • Consolidated numbers are audited only at yearend
Revenues Unit: NT$ billion
Revenues by Product 4Q02 4Q03 Electro- Mechanical Networking Products Power Related Products Components Video Displays
Gross Profit Unit: NT$ billion & % of sales
R&D Expense Unit: NT$ billion & % of sales
SG&A Expense Unit: NT$ billion & % of sales
Operating Expense Unit: NT$ billion & % of sales
Operating Profit Unit: NT$ billion & % of sales
Non-Operating Profit Unit: NT$ billion & % of sales
Non-Operating Income Breakdown Unit: NT$ million Disposal gain includes investment disposal and disposal of fixed assets
Net Income Before Tax Unit: NT$ billion & % of sales
Tax Benefit & Minority Interest Unit: NT$ billion
Net Income After Tax Unit: NT$ billion & % of sales
EPS (unit: NT$) * ALL EPS fully diluted at current shares outstanding of 1,480 million shares.
(billion NTD) Sales 40.6 vs. 39.6 102.5% Net income 5.215 vs. 4.774 109.2% Actual vs. forecast (parent company)
(billion NTD) Sales 49.542 vs. 51.472 96.3% Gross profit 10.613 vs. 10.996 96.5% SG&A 3.183 vs. 3.322 95.8% Op profit 4.289 vs. 4.675 91.7% Net income 5.215 vs. 4.774 109.3% Actual vs. forecast (consolidated)
Revenues Unit: NT$ billion
Revenues by Product 2002 2003 Electro- Mechanical Networking Products Power Related Products Components Video Displays
Gross Profit Unit: NT$ billion & % of sales
R&D Expense Unit: NT$ billion & % of sales
SG&A Expense Unit: NT$ billion & % of sales
Operating Expense Unit: NT$ billion & % of sales
Operating Profit Unit: NT$ billion & % of sales
Non-Operating Profit Unit: NT$ billion & % of sales
Non-Operating Income Breakdown Unit: NT$ million
Net Income Before Tax Unit: NT$ billion & % of sales
Net Income After Tax Unit: NT$ billion & % of sales
EPS (unit: NT$) * EPS fully diluted at current shares outstanding of 1,480 million shares.