Download
1 / 54
540 likes | 728 Views
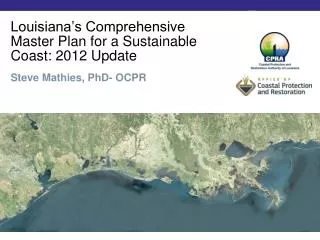
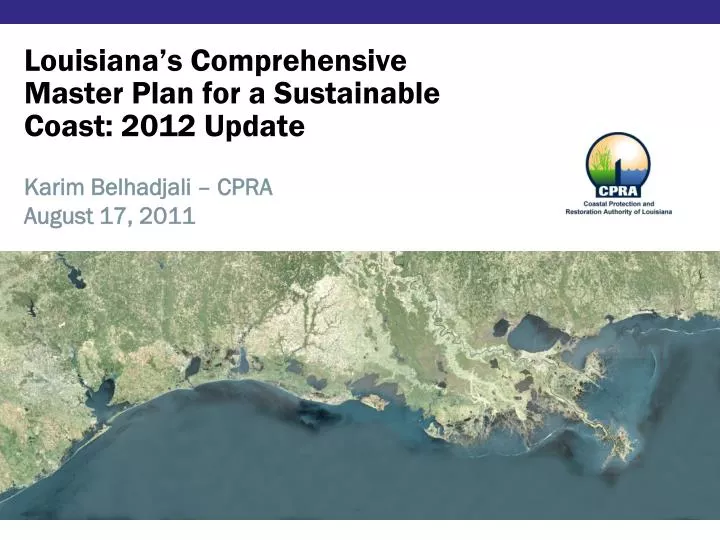
Karim Belhadjali – CPRA August 17, 2011. Louisiana’s Comprehensive Master Plan for a Sustainable Coast: 2012 Update. Key Components of 2012 Update. Specific & Realistic Goals & Objectives Project List Map showing the selected projects and what they provide: Levels of risk reduction

E N D
Karim Belhadjali – CPRA August 17, 2011 Louisiana’s Comprehensive Master Plan for a Sustainable Coast: 2012 Update
Key Components of 2012 Update • Specific & Realistic Goals & Objectives • Project List • Map showing the selected projects and what they provide: • Levels of risk reduction • Levels of ecosystem services across the coast • Extent and character of future landscape • Implementation plan with: • Schedule, Costs, Expected sources of funding • Adaptive Management plan to guide implementation
Linking Back to Master Plan Objectives • Reduce economic losses from storm-based flooding • Promote a sustainable coastal ecosystem by harnessing natural system processes • Provide habitats suitable to support an array of commercial and recreational activities coast-wide • Sustain Louisiana’s unique heritage and culture 5. Provide a viable working coast to support industry.
Predictive Models Overview • Eco-Hydrology • Mass-balance box model • Output – 16 variables • stage, salinity, sediment, water quality • Wetland Morphology • 4 submodels - changes in the landscape • Output – land change, fragmentation, elevation, SOC • Barrier Shoreline Morphology • Changes in tidal inlet area, location, area, and elevation • Vegetation • Probability of death / establishment of 21 vegetation classes, per salinity, inundation
Predictive Models (cont’d.) • Upper Trophic Level • Habitat Suitability Indices • 14 species and 1 functional group • Storm Surge and Wave • Coarsened AdCirc grid (used by USACE) • Use output from wetland /barrier morphology and vegetation to modify grid points • Output – storm surge and wave elevation • Risk Assessment (damage) • Surge elevation, value of assets (commercial, residential, infrastructure, strategic assets) • Output – flood depths and resulting residual damages ($) • Data Integration • File naming, automations, model linkages and data transfer
Modeling in a Systems Context Data Integration Stage, Salinity, Water Quality Stage, Salinity Land Configuration, Elevation Stage, Salinity Sediment Dominant Vegetation Dominant Vegetation Upper Trophic Eco-Hydrology Wetland Morphology Vegetation Land Configuration, Elevation Habitat Suitability Index Island Configuration Land Configuration, Elevation Dominant Vegetation Barrier Island Morphology Stage Surge Damage Surge, Waves Damage, $ Surge, Waves
Ecosystem Uncertainties and Scenarios • The modeling teams identified 9 key system uncertainties • Sea Level Rise • Subsidence • Storm Intensity • Storm Frequency • River Discharge / Sediment Load • River Nutrient Concentration • Rainfall • Evapotranspiration • Marsh Collapse Threshold • Range for each uncertainty represents plausible increases /decreases • Selected 3 levels for each ecosystem uncertainty
Ecosystem Uncertainties and Scenarios • MPDT developed 3 scenario projections to evaluate project effects in a future landscape: • Improving Projections (Scenario A) • Intermediate Projections (Scenario B) • Worsening Projections (Scenario C) • Represent values within the uncertainty ranges • The 3 scenarios don’t necessarily cover the entire range of possible outcomes, • Designed to reflect 3 significantly different, but reasonably-likely conditions to use when developing and evaluating alternatives. • Uncertainty data updated at 5 year Master Plan intervals
Sea Level Rise – Gulf of Mexico Rationale Source: Literature and USACE guidance
Sea Level Rise - Gulf of Mexico Values 0.2m 0.3m 0.5m
Future Without Action PRELIMINARY Draft Predicted Land Loss Predicted Land Gain Scenario B Predicted Land-Water Change from 2010-2060
Future Without Action PRELIMINARY Draft Predicted Land Loss Predicted Land Gain Scenario C Predicted Land-Water Change from 2010-2060
Future Without Action PRELIMINARY Draft Predicted Land Change from 2010-2060
Importance of A Vision • Past plans guided by broad goals and project-specific objectives • Provides a common view about what we want to achieve • A path to focus state investments • Ability to understand and confront trade-offs We want the vision to be AMBITIOUS and ACHIEVABLE ?
How are the targets used to analyze projects? • First we need to understand the current level of the service provided • Next, we evaluate the service under Future Without Action conditions What is at stake? • Then, we evaluate the level of the service provided under Future With Project • Projects are selected based on their ability to meet the targets under variable future conditions This provides the vision for what the future coast of Louisiana will provide to its citizens
Master Plan Vision Specifies Storm SurgeFlood Risk Reduction Across the Coast • Risk reduction targets established for each coastal community to guide investments • 500-year protection • 100-year protection • 50-year protection • Focus on economic losses due to flooding of built infrastructure • Buildings • Roads • Railroads • Crops
Multiple Approaches to Reduce Flood Risk • Structural protection (e.g. levees) • Non-structural protection (e.g. elevating structures) • Ecosystem restoration
Risk Reduction Evaluation Process • Establish preliminary flood risk reduction targets for coastal communities (50-yr, 100-yr, 500-yr) • Develop conceptual structural projects and attributes (e.g. elevation of tops of levees) • Develop conceptual nonstructural projects and attributes (e.g. house first floor elevations) • Determine surge and wave elevations (from modeling) • Calculate damages due to flooding for each project (structural and nonstructural)
1. Establish Preliminary Flood Risk Reduction Targets • This effort focuses on developing an objective approach • Establishes a rationale based on population rather than assets • Population density • Total population • Uses 2010 Census Data • Establishes some level of protection across the inhabited areas of the coast
1. Establish Preliminary Flood Risk Reduction Targets • Population Density 1,000 people per square mile is one criteria of an Urbanized Area used by several federal agencies and other programs and was used as the minimum density to move beyond 50-year target. • < 1,000 people per square mile = 50-year • > 1,000 people per square mile = consider total population
1. Establish Preliminary Flood Risk Reduction Targets • Total population Criterion to differentiate higher levels of risk reduction for areas with > 1,000 people/sq-mile • < 5,000 people– 50-year • > 5,000 and < 75,000 people – 100-year • > 75,000 people – 500-year • Total population determined by contiguous census blocks meeting density criteria
Risk Reduction Target Areas • Targets do not guarantee that the level of risk reduction will be achieved. • Some areas will not meet the targets, while other areas may gain a greater level of risk reduction. • Uninhabited areas of the coast will not be targeted for risk reduction. • Risk reduction is achieved through the construction of: • levee and floodgate systems, • enhancement of natural landscape elements, and • nonstructural measures.
2. Structural Protection Projects • Structural protection projects selected from various existing conceptual design reports • Elevations for tops of levees and floodgates taken from conceptual design report • Verified that all elevations verified are on same datum (NAVD88) • ~ 34 Projects
3. Nonstructural Protection Projects • Nonstructural Projects consist of: • Nonresidential flood proofing • Residential flood proofing • Elevation of residential structures • Acquisition of residential structures • Projects are defined by location: • Parish • Community • Areas protected by structural projects
3. Nonstructural Protection Projects • Approach to Setting Flood proofing Elevation • FEMA base flood elevation (FBFE) as found on the preliminary Digital Flood Insurance Rate Maps • Two variations of the same project based on different freeboard amounts for residential. • FBFE+1’ ( typically found in ordinances) • FBFE+4’ (achievable, yet higher standard) • All nonresidential assets flood proof elevation 0 - 3 ft above ground
3. Nonstructural Protection Projects • Nonstructural Project Attributes • Flood proof elevation • Structure classification • Participation rates • Project costs • Unit cost by class, square footage, and elevation • Uncertainty estimates on costs • Duration to Implement • Uncertainty estimates on duration
3. Nonstructural Protection Projects • Nonstructural Projects • Residential (0’ < FBFE depth ≤ 3’) • Residential elevation to FEMA’s BFE plus 1 or plus 4 foot (3’ <FBFE depth ≤ 18’) • Non-residential floodproofing (0’ - 3’) • Acquisition of residential structures that would need to be elevated greater than 18 feet to reach the FBFE+1 • Community areas targeted for 500 year risk reduction • Community areas targeted for 100 year risk reduction • Parishes targeted for 50 year risk reduction • Areas protected by conceptual structural protection projects
Project Totals Total of 414 projects
Additional Nonstructural Programs • Programs • Land use planning, ordinances, public education, hazard mitigation planning, building codes, etc. • Not easily evaluated, but critical to successful coast wide nonstructural risk reduction
4. Determine Surge and Wave Elevations • Models Estimate Flood Damage Across the Coast Surge and Wave models (ADCIRC): • Estimate surge and wave heights across coast for 40 storms • Coarsened AdCirc grid (used by USACE) • Use output from wetland /barrier morphology and vegetation to modify grid points • Flood and Risk model: • CLARA: Coastal Louisiana Risk Assessment model • Simulates flood depth for hundredsof synthetic storms • Calculates economic damages to physical assets
5. CLARA Estimates Flooding from Storms 1) Storm surge elevations in unprotected areas 2) Water entering protected area due to overtopping 3) Potential failure of the protected system 4) Final storm surge flood depths • Estimate flooding due to failure of the protected system • Equalize flood elevation among adjacent protected areas • Estimate quantity of water that enters protected areas due to overtopping and flow around • Estimate elevation of storm surge and waves in unprotected areas
5. CLARA Estimates Losses from Flooding • Calculate assets at risk • Inventory of assets for each census block • Evaluate scenarios of future economic growth and level of urbanization • Estimate monetary damages from floods of a given depth • Calculate losses for each storm using modeled flood depth Calculations performed for each census block $ Assets at risk Flood Depth Damages By flood depth $ Monetary losses $
Planning Tool Develops and Evaluates Projects that Reduce Risk • Protection target levels (e.g. 100-year) establish risk reduction goals • PT defines projects to maximize risk reduction across coast Example for Community with 100-year Protection Target Risk Reduction Damage (100-year recurrence) • Target: • 100-year protection • No damage @ 100-year interval FWOA Proj. 1 Proj. 2
Change in Flood Depths – 50 year Difference Between Current and FWOA Change in Flood Depth • Assumptions: • 100% Pumping • No Fragility
Change in Flood Depths – 100 year Difference Between Current and FWOA Change in Flood Depth • Assumptions: • 100% Pumping • Nominal Fragility
Change in Flood Depth – 500 year Difference Between Current and FWOA Change in Flood Depth • Assumptions: • 100% Pumping • Nominal Fragility
Important Dates 2011 July – Sept Regional Community Meetings July – Dec Continue Outreach Efforts Website Updates with New Information Available to Speak to Citizen Groups Jan Draft Coastal Master Plan Released Jan 23 Public Meeting in New Orleans Jan 24 Public Meeting in Houma Jan 25 Public Meeting in Lake Charles Jan – Feb Stakeholder Engagement and Feedback March Submit Final Plan to LA Legislature 2012 Once approved by the Louisiana Legislature, implementation of this plan will begin.