Download
1 / 14
140 likes | 290 Views
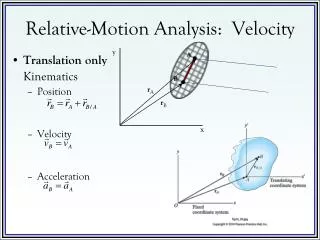
ENGINEERING LOG JAMS. VELOCITY ANALYSIS Randi Mendes. BACKGROUND. Benefits Bank Stabilization Fish Habitat Fish Feeding. Randi Mendes, Oregon State University 22 August 2013. RESEARCH QUESTION. Is there a Relationship between Fish Behavior and Engineered Log Jams?

E N D
ENGINEERING LOG JAMS VELOCITY ANALYSIS Randi Mendes
BACKGROUND • Benefits • Bank Stabilization • Fish Habitat • Fish Feeding Randi Mendes, Oregon State University 22 August 2013
RESEARCH QUESTION Is there a Relationship between Fish Behavior and Engineered Log Jams? Are there trends in the velocity profiles surrounding the log jam? http://www.sciencedaily.com/releases/2009/06/090610091224.htm Randi Mendes, Oregon State University 22 August 2013
METHODS • Data Collection • Velocity: Sontek Micro ADV (Acoustic Doppler Velocimeter) Devices www.sciencedirect.com Randi Mendes, Oregon State University 22 August 2013
METHODS • Velocity Analysis • Contour Plots • XY-plane, YZ-plane • Quiver (vector) Plots • XY-plane, YZ-plane Randi Mendes, Oregon State University 22 August 2013
METHODS • Contour and Quiver Plots • 3 planes • XY, YZ, XZ • Slices within each plane • XY-plane: Horizontal Slices in the Z direction • YZ-plane: Vertical Slices in the X direction • XZ-plane: Vertical Slices in the Y direction • Every 10cm • Height Layer Randi Mendes, Oregon State University 22 August 2013
METHODS • Creating Grids • Excel • Determine max and min X, Y, and Z values • Coordinates from ADVs • Use these values to create a two dimensional grid • Plot values of velocity magnitude on grid • Calculation depends on plane • Use ‘Average Velocity X, Y, Z’ values • Equation: Randi Mendes, Oregon State University 22 August 2013
METHODS • Top Picture: • XY-plane • Magnitude of Velocity in X, Y • Bottom Picture: • YZ-plane • Magnitude of Velocity in Y, Z Randi Mendes, Oregon State University 22 August 2013
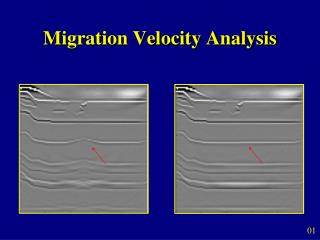
METHODS • Matlab • X, Y, Z matrices • Meshgrid function • Contour function Figure 1: Contour plot of the top layer slice in the XY-plane Randi Mendes, Oregon State University 22 August 2013
METHODS • Matlab • X, Y, U,V matrices • Meshgrid function • Quiver function Figure 2: Quiver plot of the top layer slice in the XY-plane Randi Mendes, Oregon State University 22 August 2013
Above: Top Layer Slice in XY-plane Below: Third Layer Slice in XY-plane Above: Second Layer Slice in the XY-plane Below: Fourth Layer Slice in the XY-plane
Above: 1st slice in the YZ-plane (16.0-16.49) Below: 3rd slice in the YZ-plane(17.0-17.49) Above: 2nd slice in the YZ-plane (16.50-16.9) Below: 4th slice in the YZ-plane (17.50-17.49)
FINDINGS • Contour Plots • Higher values of velocity (m/s) • Isolated spots • Further from log jam • Middle layer between log jam and river ground • Lower values of velocity • Right along and close to log jam • Lower sections • Quiver Plots • Pools created in the higher sections of log jams Randi Mendes, Oregon State University 22 August 2013
QUESTIONS?? Randi Mendes, Oregon State University 22 August 2013