Indifference curves
Indifference curves. Indifference curves represent a summary of the consumer’s taste and preferences for various products.

Indifference curves
E N D
Presentation Transcript
Indifference curves Indifference curves represent a summary of the consumer’s taste and preferences for various products.
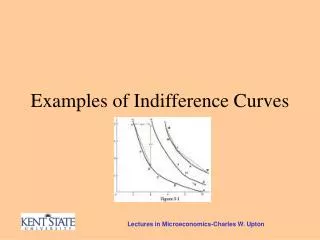
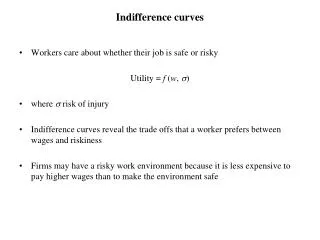
There is no accounting for the taste of the consumer. Consumers like what they like(various things influence what they like - advertising, customs...). Consumers derive utility or happiness by consuming goods and services. In economics we summarize the likes or tastes of the consumer by using indifference curves. An indifference curve shows different combinations of goods that give the same level of utility to the consumer.
Diagram used in analysis good y The amount of good y a consumer may have is measured vertically good x The amount of good x is measured on the horizontal axis. This type of diagram is used extensively when considering the behavior of consumers.
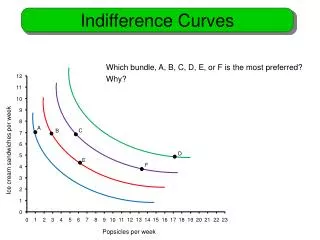
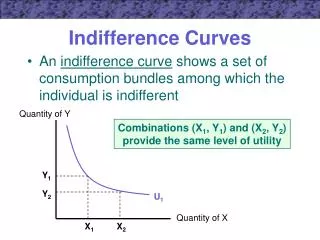
Indifference curves - definition • As mentioned earlier, an indifference curve shows various combinations of goods that yield some specific level of utility or satisfaction for the individual. y This is one type of indifference curve. We assume the individual is equally happy at point A or B or any other point on the indifference curve. A B x
Indifference curves - feature 1 • We assume more goods are preferred to less and thus indifference curves slope downward to the right. y Say the individual is at the point in the middle of the graph. Keep this in mind as we explore the following screens. 2 1 3 4 x
Indifference curves - feature 1 • If the individual is at the point in the diagram, then all those points in area 1 and on the boundary are more preferred because those points have either more of both items or more of one and the same amount of the other item compared to the point chosen. • Points in area 3 and the boundary are less preferred to the point in the diagram because the point chosen has more of both items.
Indifference curves - feature 1 • An individual may think that points in areas 2 and 4 are preferable, less preferred or equally desirable to the point indicated. • Since areas 2 and 4 are the only ones that could have a point of indifference to the one chosen, the indifference curves must have negative slope.
slope In economics we often use graphs and with graphs you can look at the concept called slope. Often in economics the idea of slope will have an economic interpretation. Let’s review the idea of slope. Slope = rise/run. With a curve that slopes downward from left to right the slope is a negative number. With a curve that slopes upward from left to right the slope is a positive number.
Indifference curves - feature 2 y Say the consumer is at point A. If the consumer gives up one unit of x, m units of y must be given back to hold the consumer at a constant level of utility. You could say the consumer is willing to trade 1 unit of x to get m units of y. B m A x 1
Indifference curves - feature 2 • The shape of the indifference curve on the previous screen is said to be convex. • Part of the reason for this is that it is assumed that the amount of good y one receives in return for one unit of x depends on how much of each the individual starts out with.
Indifference curves - feature 2 y You can tell that point A has less x than at B. As the individual takes even one less unit of x from either point A or B, some y must be given in return. But more is given in return if point A is the initial point. A B x The point is the less you have of something(like x at point A compared to point B), the more of other things you must be given in return to compensate for the loss of the one unit, assuming the same level of utility is obtained.
Indifference curves - feature 2 • The marginal rate of substitution(MRS) is the amount of y given in return for the one unit of x, while maintaining the same level of utility. • We can think of the MRS as a fraction: • MRS=absolute value of (change in y)/(change in x) . • In this sense, the MRS is the absolute value of the slope of the curve at various points. Note the slope changes from point to point. In absolute value the fraction gets smaller the farther down the curve one moves. This is another way of saying the curve gets flatter.
feature 2 In general, it is assumed that consumers value additional units of a good less and less the more they have of the good. (Or you could say when consumers give up good x they require more and more of good y the less of good x they start with.) The indifference curve gets flatter. This notion is summarized with the phrase – diminishing marginal rates of substitution.
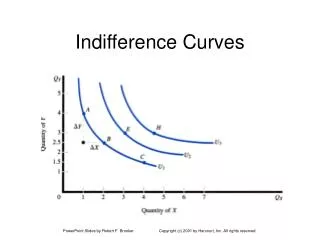
Indifference curves - feature 3 y Indifference Map Every point in the graph has one, and only one, indifference curve running through it. Curves farther out from the origin have more utility. So, the consumer can compare every bundle and make a determination of preference or indifference. x
Indifference curves - feature 4 y Indifference curves for an individual do not cross. Say they did, like in this diagram. Then individual would be indifferent to A and B, indifferent to A and C, and thus by logic should be indifferent to B and C. C A B x But C has more of both goods compared to B and thus C is preferred to B. So the curves can not cross for an individual. Transitivity of preferences holds.
Indifference curves - feature 5 • Different people can have different general shapes of indifference curves. Some are relatively steep and some are relatively flat. • On the next slide I will put two peoples’ indifference curves and they will cross. Before we said one individual’s curves could not cross.
Indifference curves - feature 5 y Mr. A Mr. B x Note how Mr. A has a steeper curve than Mr. B. From the point where the curves cross if both give up a unit of x, note how Mr. A has to be given more y to make up for the loss of x than Mr. B. Mr. A is said to have a relatively strong preference for x because he needs much more y in return for the one unit of x given up.
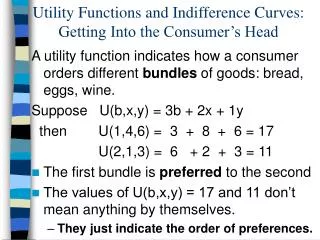
A math example of a utility function might be U = sqrt(XY) – this means utility is a function of the square root of the product of the amount of x and the amount of y a person would get. To get an indifference curve pick a value of U. Let’s say U = 4. Then some points on the indifference curve would be X Y 16 1 1 16 4 4 8 2 2 8
MA-ECONOMICSGUESS PAPERS BY KHALID AZIZ AVAILABLE AT: R-1173,3RD FLOOR ALNOOR SOCIETY, BLOCK 19 F.B.AREA, KARACHI. 0322-3385752 & AL JAMIA BOOK HOUSE NEAR ICMAP, NIPA CHOWRANGI, GULSHAN-E-IQBAL KARACHI.
MA-ECONOMICS I STATISTICS PAPER III IN JUST 15 DAYS CONTACT: KHALID AZIZ 0322-3385752